An On-Chain Investigation
RWAs,
Unwrapped
We put a name to 83 percent of the tokenized RWA market on Ethereum.
The names are what make it readable: who is buying, what they do with what they hold, and how much of it is real.
Opening · Who holds RWAs
Who holds tokenized real world assets?
Putting names to the market
This is every holder of tokenized real world assets on Ethereum, drawn as a single map. It is built entirely from public on-chain data. The work that makes it more than a list of anonymous wallets is the attribution, matching the addresses that hold this market to the real entities behind them. We can account for 83 percent of the value here by name.
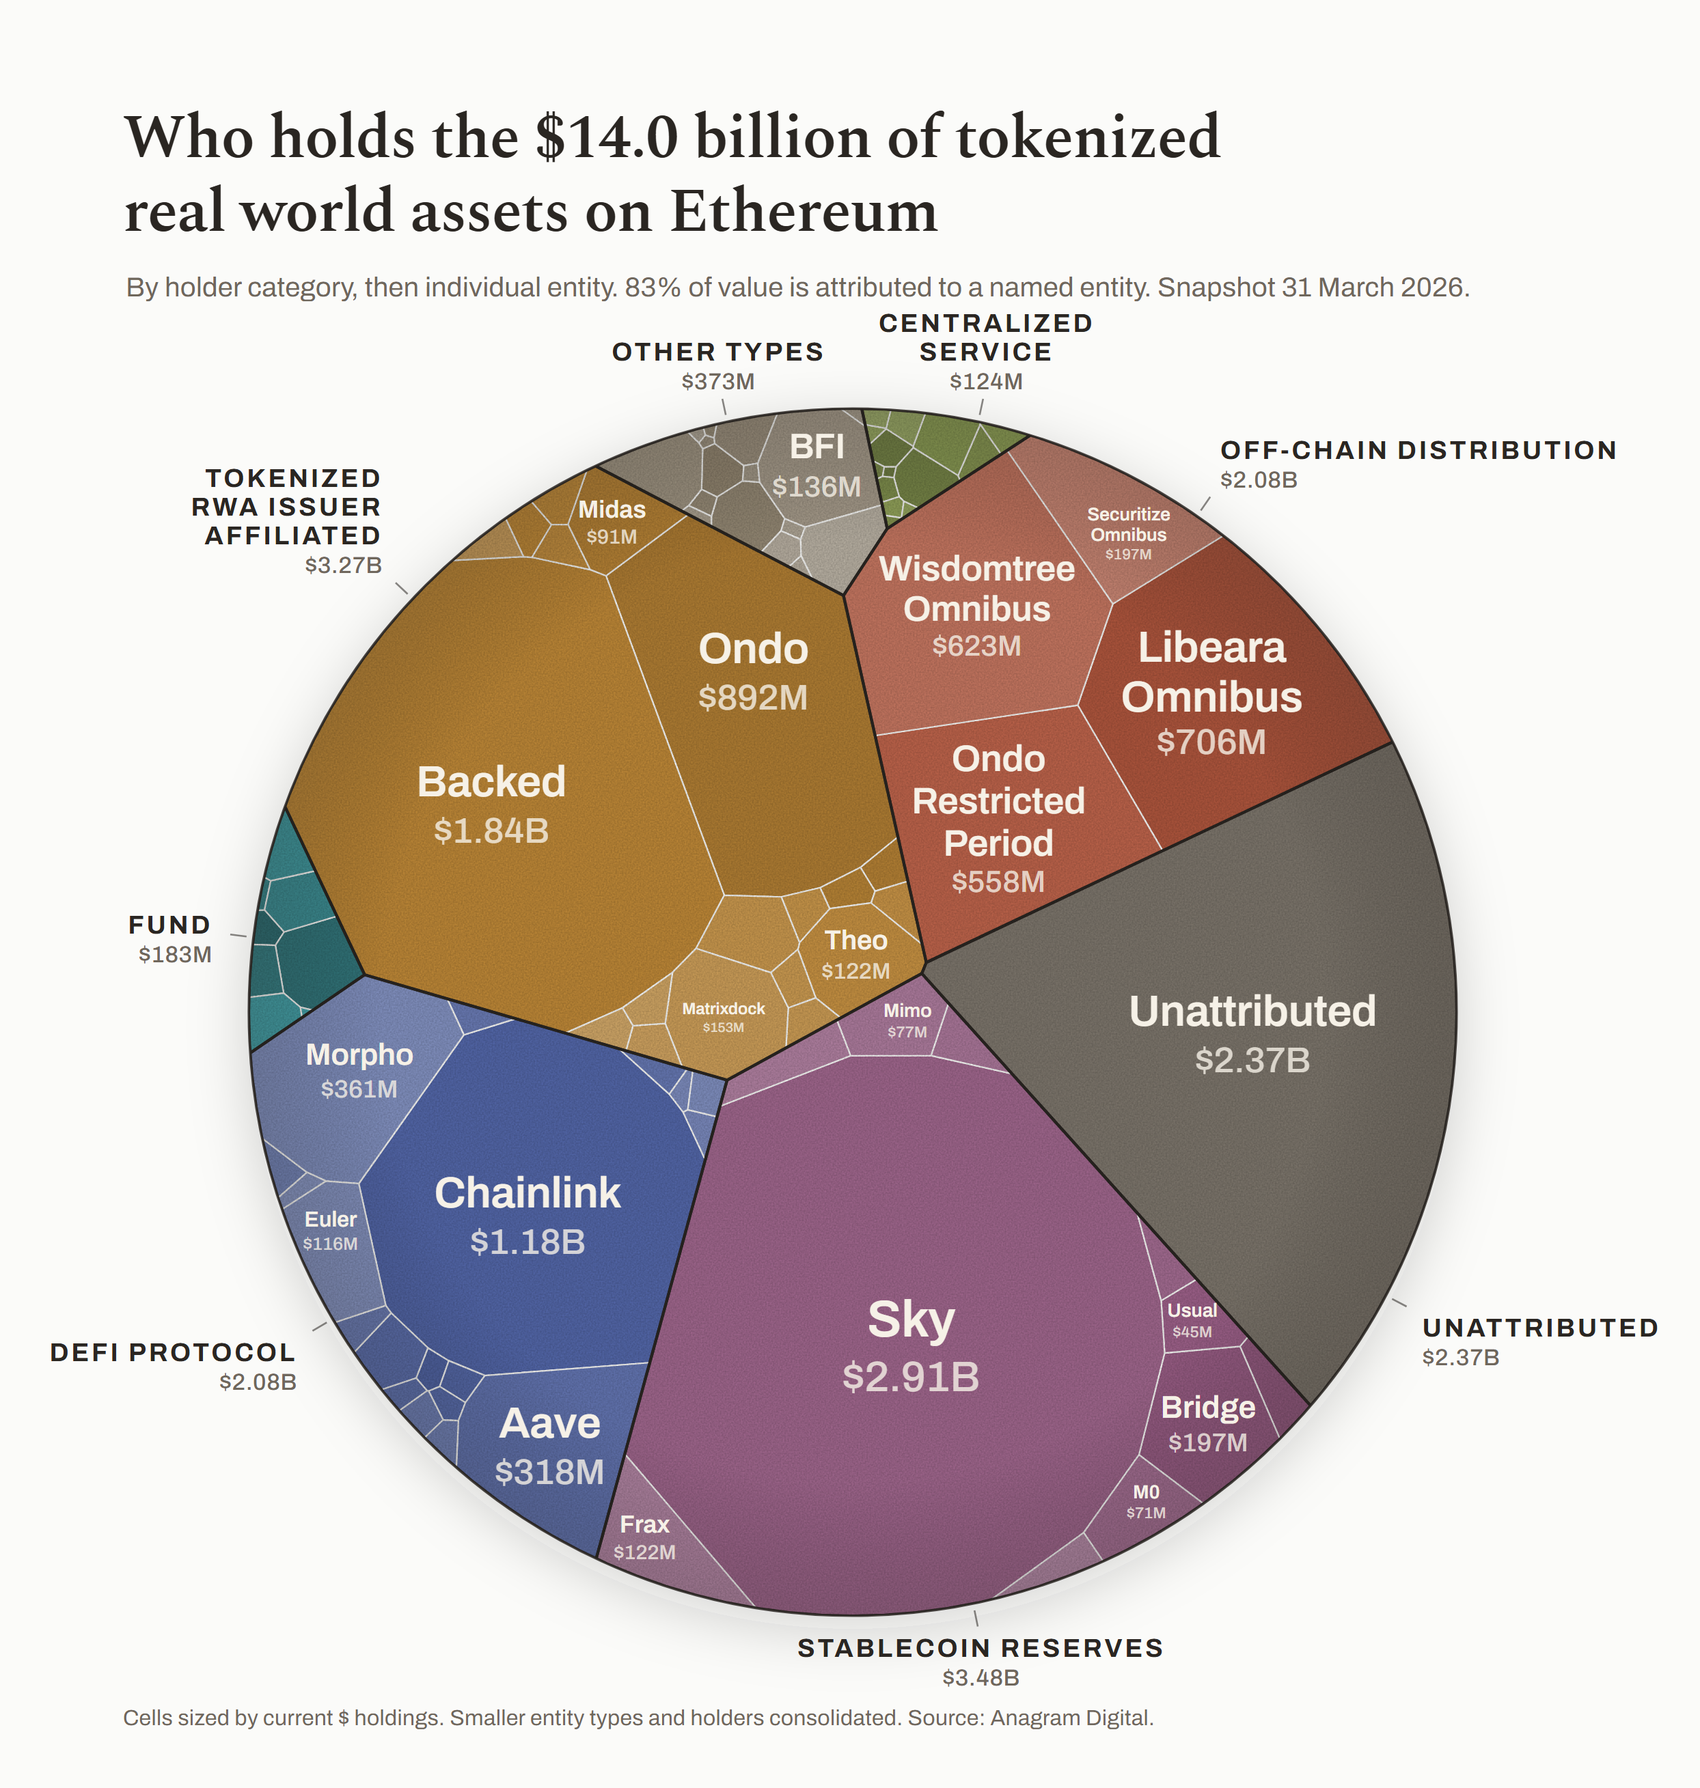
Read as one number, this is a headline. Read holder by holder, it is a different market.
Start with the picture
The map above is the entire market, every holder on a single page. Each cell is one holder, sized by how much it holds and colored by the kind of entity behind it, every balance read straight from the chain. The chain does not come with names, though, and a list of anonymous balances cannot answer much on its own. The work behind this map is putting names to those balances, holder by holder, and it is the foundation the rest of the report stands on.
Why this matters
Tokenization's totals get quoted as proof that it has arrived. But the same billion-dollar balance can be an outside investor putting capital to work, a trading venue, a lending protocol, or an issuer holding unsold inventory of its own token. As numbers they look identical. What separates substance from story is knowing who the holders are and what they do with what they hold. That question runs through this report, and it is why the map comes first.
The shape of the market, by token
A handful of tokens carry most of the value, and the names below recur throughout the report.
| Token | Manager · Platform | Category | Value on Ethereum | Transfer model |
|---|---|---|---|---|
| syrupUSDC | Maple | Crypto Credit | $1.82b | Open |
| JTRSY | Janus Henderson · Centrifuge | US Treasuries | $1.17b | Gated |
| BUIDL | BlackRock · Securitize | US Treasuries | $1.01b | Gated |
| syrupUSDT | Maple | Crypto Credit | $1.00b | Open |
| WTGXX | WisdomTree | US Treasuries | $0.81b | Gated |
| BCAP | Blockchain Capital · Securitize | Venture Capital | $0.76b | Gated |
| USTB | Superstate | US Treasuries | $0.62b | Gated |
| cUSDY | Ondo | US Treasuries (pending issuance) | $0.56b | Gated |
| CUMIU | ChinaAMC · Libeara | US Treasuries | $0.55b | Gated |
| USDY | Ondo | US Treasuries | $0.54b | Blocklist |
| TBLLx | xStocks | US Treasuries | $0.50b | Blocklist |
| OUSG | Ondo | US Treasuries | $0.32b | Gated |
| CFSRS | Asseto | Real-Economy Credit | $0.21b | Gated |
| FDIT | Fidelity Investments | US Treasuries | $0.17b | Gated |
| USCC | Superstate | Hedge Funds | $0.15b | Gated |
| Top 15 total | $10.19b | |||
| All in-scope | $13.96b |
What the map already shows
A few cells dominate while a long tail of smaller holders fills the edges. The single largest holder is not an asset manager but Sky, the DeFi stablecoin protocol once known as MakerDAO, holding about $2.9 billion as reserves backing its stablecoin. Other large regions belong to names you might not expect, the issuers themselves holding their own product among them. And a meaningful share sits in the pale region we have not yet attributed. The sections that follow take these one at a time.
Figures cover in-scope tokenized real world assets on Ethereum as of 31 March 2026. Total $13.96 billion. Holdings are read directly from on-chain balances. Holders are identified by matching addresses to known entities. Of the value shown, 83 percent is attributed to a named holder, and the remainder is grouped as unattributed. Pooled custodial and wrapper accounts are shown as single holders, so the number of beneficial owners behind them is larger than the cells suggest. We attribute the holdings of Sky's capital-allocation units, including Spark, Grove, Obex, and Keel, to Sky itself rather than counting them as separate holders, since each deploys or is funded by Sky's own USDS reserves under allocations approved by Sky governance. Full sources and methodology in appendix. Source: Anagram Digital.
About this report
The author, the data, and how to read it
About Anagram Digital
Anagram Digital is a blockchain intelligence firm. What we do is attribution: putting real-world names to the anonymous wallets that hold and move funds on public blockchains, and reconstructing how the money flows between them. Law firms, funds, and investigators bring us the matters where the on-chain facts have to be right: expert testimony and litigation support, tracing disputed or stolen funds, and due diligence on tokens and counterparties. This report is that capability turned on tokenized real-world assets, which is how it names holders that the usual dollar-counting trackers cannot.
Authors
This report is primary research by Max Galka, founder of Anagram Digital and previously founder and chief executive of Elementus, a blockchain analytics company. Alex Mologoko, previously head of digital-assets and markets research at CipherTrace, contributed to the research.
What this report covers
The subject is tokenized real world assets on Ethereum: the tokenized treasuries, private credit, funds, and similar instruments that represent assets from the world off-chain. It excludes stablecoins, passive crypto exchange-traded products, and tokenized commodities. Holdings are read directly from on-chain balances as of 31 March 2026, a market of $13.96 billion in all.
Most published RWA totals are larger. Some roughly double ours by adding the other public blockchains we do not cover. Others are larger by an order of magnitude because they count assets that are only represented on permissioned ledgers, where a token records an asset whose ownership still settles in the conventional system. We study distributed assets, tokens openly issued and freely transferable on a public blockchain, where ownership is the token itself, because only there can tokenization's distinctive promises (self-custody, composability, and open access) actually be tested. Tokenized private credit in particular sits largely on the represented side, so the private-credit figures here cover only its distributed slice. Among distributed assets, Ethereum is the largest venue, holding more than half of all such value,1 so we read it as a representative window and flag where a finding could be skewed by what settles on other public chains.
How the numbers were produced
Two layers sit behind every figure. The balances are observed: read directly from on-chain state as of the snapshot, and any reader can reproduce them. The identities behind them are inferred: matched to issuers, protocols, exchanges, and a wide range of other on-chain services using Anagram Digital's proprietary entity-resolution technology and specialized expertise. The attribution runs to venues as well as holders, and that venue map is what makes the usage and liquidity measures later in the report possible. Of the value studied here, 83 percent is attributed to a named holder.
Attribution is a judgment, not a direct reading, and we treat it as such. Where a single attribution carries a finding, as with the Ondo holdings in Section 6, we set out the specific on-chain evidence behind it, address by address, and say how confident we are. The full sources and methodology are in the appendix.
How to read it
The report opens with a single map of the entire market and reads it one question at a time: is there real substance behind the growth, or is it mostly story? Each finding weighs in on the evidence rather than bent toward a verdict.
Executive summary
The findings, in brief
We mapped every holder of tokenized real world assets on Ethereum, $14 billion in all, and put a name to 83 percent of it. Read holder by holder, the market has less independent substance than the headline suggests, and a few corners where something real is taking hold. Six findings follow, led by what surprised us most. Where one turns on a single name, such as Ondo, it is a worked example of a method applied to every holder, not a company singled out in advance.
85 percent of one flagship token's circulating float sits in wallets our on-chain analysis links to its own issuer or the issuer's affiliates
38 percent of the market, $5.35 billion, sits in wallets the issuers, their platforms, and their affiliates operate. The extreme case is Ondo's USDY: 85 percent of its circulating float sits in eight wallets, funded from a single source, that our on-chain analysis links to Ondo or entities affiliated with it. The market's largest holder, Sky's $2.9 billion of stablecoin reserves, sits outside that share entirely, real outside demand from crypto's own economy.
Reads as More story than substanceHalf of all tokens have tried DeFi. Five do nearly all the work
Tokens carrying two-thirds of the market's value have touched DeFi, most of it early testing. Genuine, repeated use is five tokens and 91 percent of the volume. But that volume is up 26-fold in fifteen months, from a small base, and the testing runs across treasuries, credit, and equities alike.
Reads as Small, but real and growingTokenization's liquidity is five tokens, not the asset class
The roughly 30 percent monthly turnover in private markets is almost entirely five cash-like tokens designed for on-demand redemption. The forty-one genuinely illiquid tokens trade no more freely than their off-chain versions.
Reads as More story than substance$3.3 billion of tokenized assets would transfer to a wallet sanctioned for terrorism financing
We tested every token against the sanctions list, in simulation. Just over half the value is gated to approved holders. Five in six tokens never check who is eligible to hold them, and the most open, 28 of them, screen no one at all.
Reads as Real, but double-edgedOne gate, three markets
The compliance model explains the rest of the report. Gated tokens hold the value, non-gated tokens hold the small holders, and open tokens carry nearly all the on-chain use. The capital the bull case needs and the on-chain substance sit on opposite sides of the gate.
Reads as The market's central fault lineHow we put a name to an anonymous wallet
The map is only as good as the attribution beneath it, so we show the work twice: the eight wallets behind 85 percent of USDY’s float, linked by on-chain evidence to Ondo or its affiliates, and a $706 million wallet, the largest we could not place at a glance, resolved to the fund platform that operates it. The receipts for everything above.
Reads as The method, in fullContents
What is inside
Finding 01 · Issuer-affiliated holdings
How much is held by the issuers and their affiliates
A large share sits in issuer-affiliated wallets, not with independent on-chain buyers
A large share of the market sits in wallets operated by the issuers, their platforms, and their affiliates rather than with independent buyers holding the token on-chain. Two very different things live inside that number, the issuers holding their own product and outside investors pooled in custody, and each complicates the $14 billion total in its own way.
Eight wallets, funded from one source, hold 85 percent of a flagship token's circulating float. The evidence points back to the issuer, or entities affiliated with it.

Much of the map is wallets the issuers run
One of the map's largest combined regions is not pension funds or asset managers taking on exposure. It is wallets the issuers, their platforms, and their affiliates operate, about $5.35 billion, roughly 38 percent of the total. About $3.27 billion is the issuers holding tokens tied to their own businesses. About $2.08 billion is outside investors pooled in custodial wallets the issuers or their platforms run on their behalf. The first is supply that looks like demand. The second is real demand that never reaches the chain. Throughout this report, issuer is shorthand for the party operating a token's on-chain program, whether the asset manager itself, like Ondo, or the tokenization platform acting as its agent, like Securitize for BlackRock's BUIDL or Libeara for ChinaAMC's money funds.
What the headline looks like once you net the issuers out
Stated as a simple waterfall, the adjustment is large.
The issuers holding their own product
An issuer can hold its own token in several reasonable ways, and each grows the headline without adding a buyer
Treasury parks the issuer's own balance sheet in the assets it issues. Unsold inventory is minted supply no one has bought yet. Cross-backing holds token B in order to issue token A, and Ondo, by its own public account, builds products of this kind. Redemption float sits on the issuer's books until the burn is finalized. All are ordinary practice.
But each raises the market total with no new participant arriving, and when token A is backed by token B and both are counted, the same underlying dollar appears twice. From the headline number alone, none of it can be told apart from a genuine outside purchase.
Backing bought by a third party is a different thing, and we count it as demand
The netting here removes only tokens tied to the issuer's own business. When an outside party buys a tokenized asset to back a product of its own, as Sky, the market's largest holder, does with the $2.9 billion of reserves behind its stablecoin, that is an independent buyer putting capital into the asset. It is crypto-native demand rather than traditional capital arriving, but it is demand, and it stays in the independently held total. We hold that classification, and a reader who draws the line differently can reprice the market with the numbers on this page. Treat the $2.9 billion as demand internal to the crypto system rather than outside capital and it moves across the line: the independently held market becomes about $7.8 billion rather than $10.69 billion, and the value held directly on-chain by independent owners becomes about $5.7 billion rather than $8.61 billion. The classification is a judgment call. The data lets a reader take either side of it.
Eight wallets hold 85 percent of one flagship token's circulating float
The clearest case is Ondo's USDY, a tokenized dollar that pays a Treasury yield. Eight wallets hold 85 percent of its circulating float on Ethereum between them, about $456 million of $537 million, and all of them trace back to a single funding hub.
Because they share that funding, on-chain they behave as one holder rather than eight independent investors. The concentration is observed. The common control is our assessment from the on-chain pattern, not a label any wallet carries.
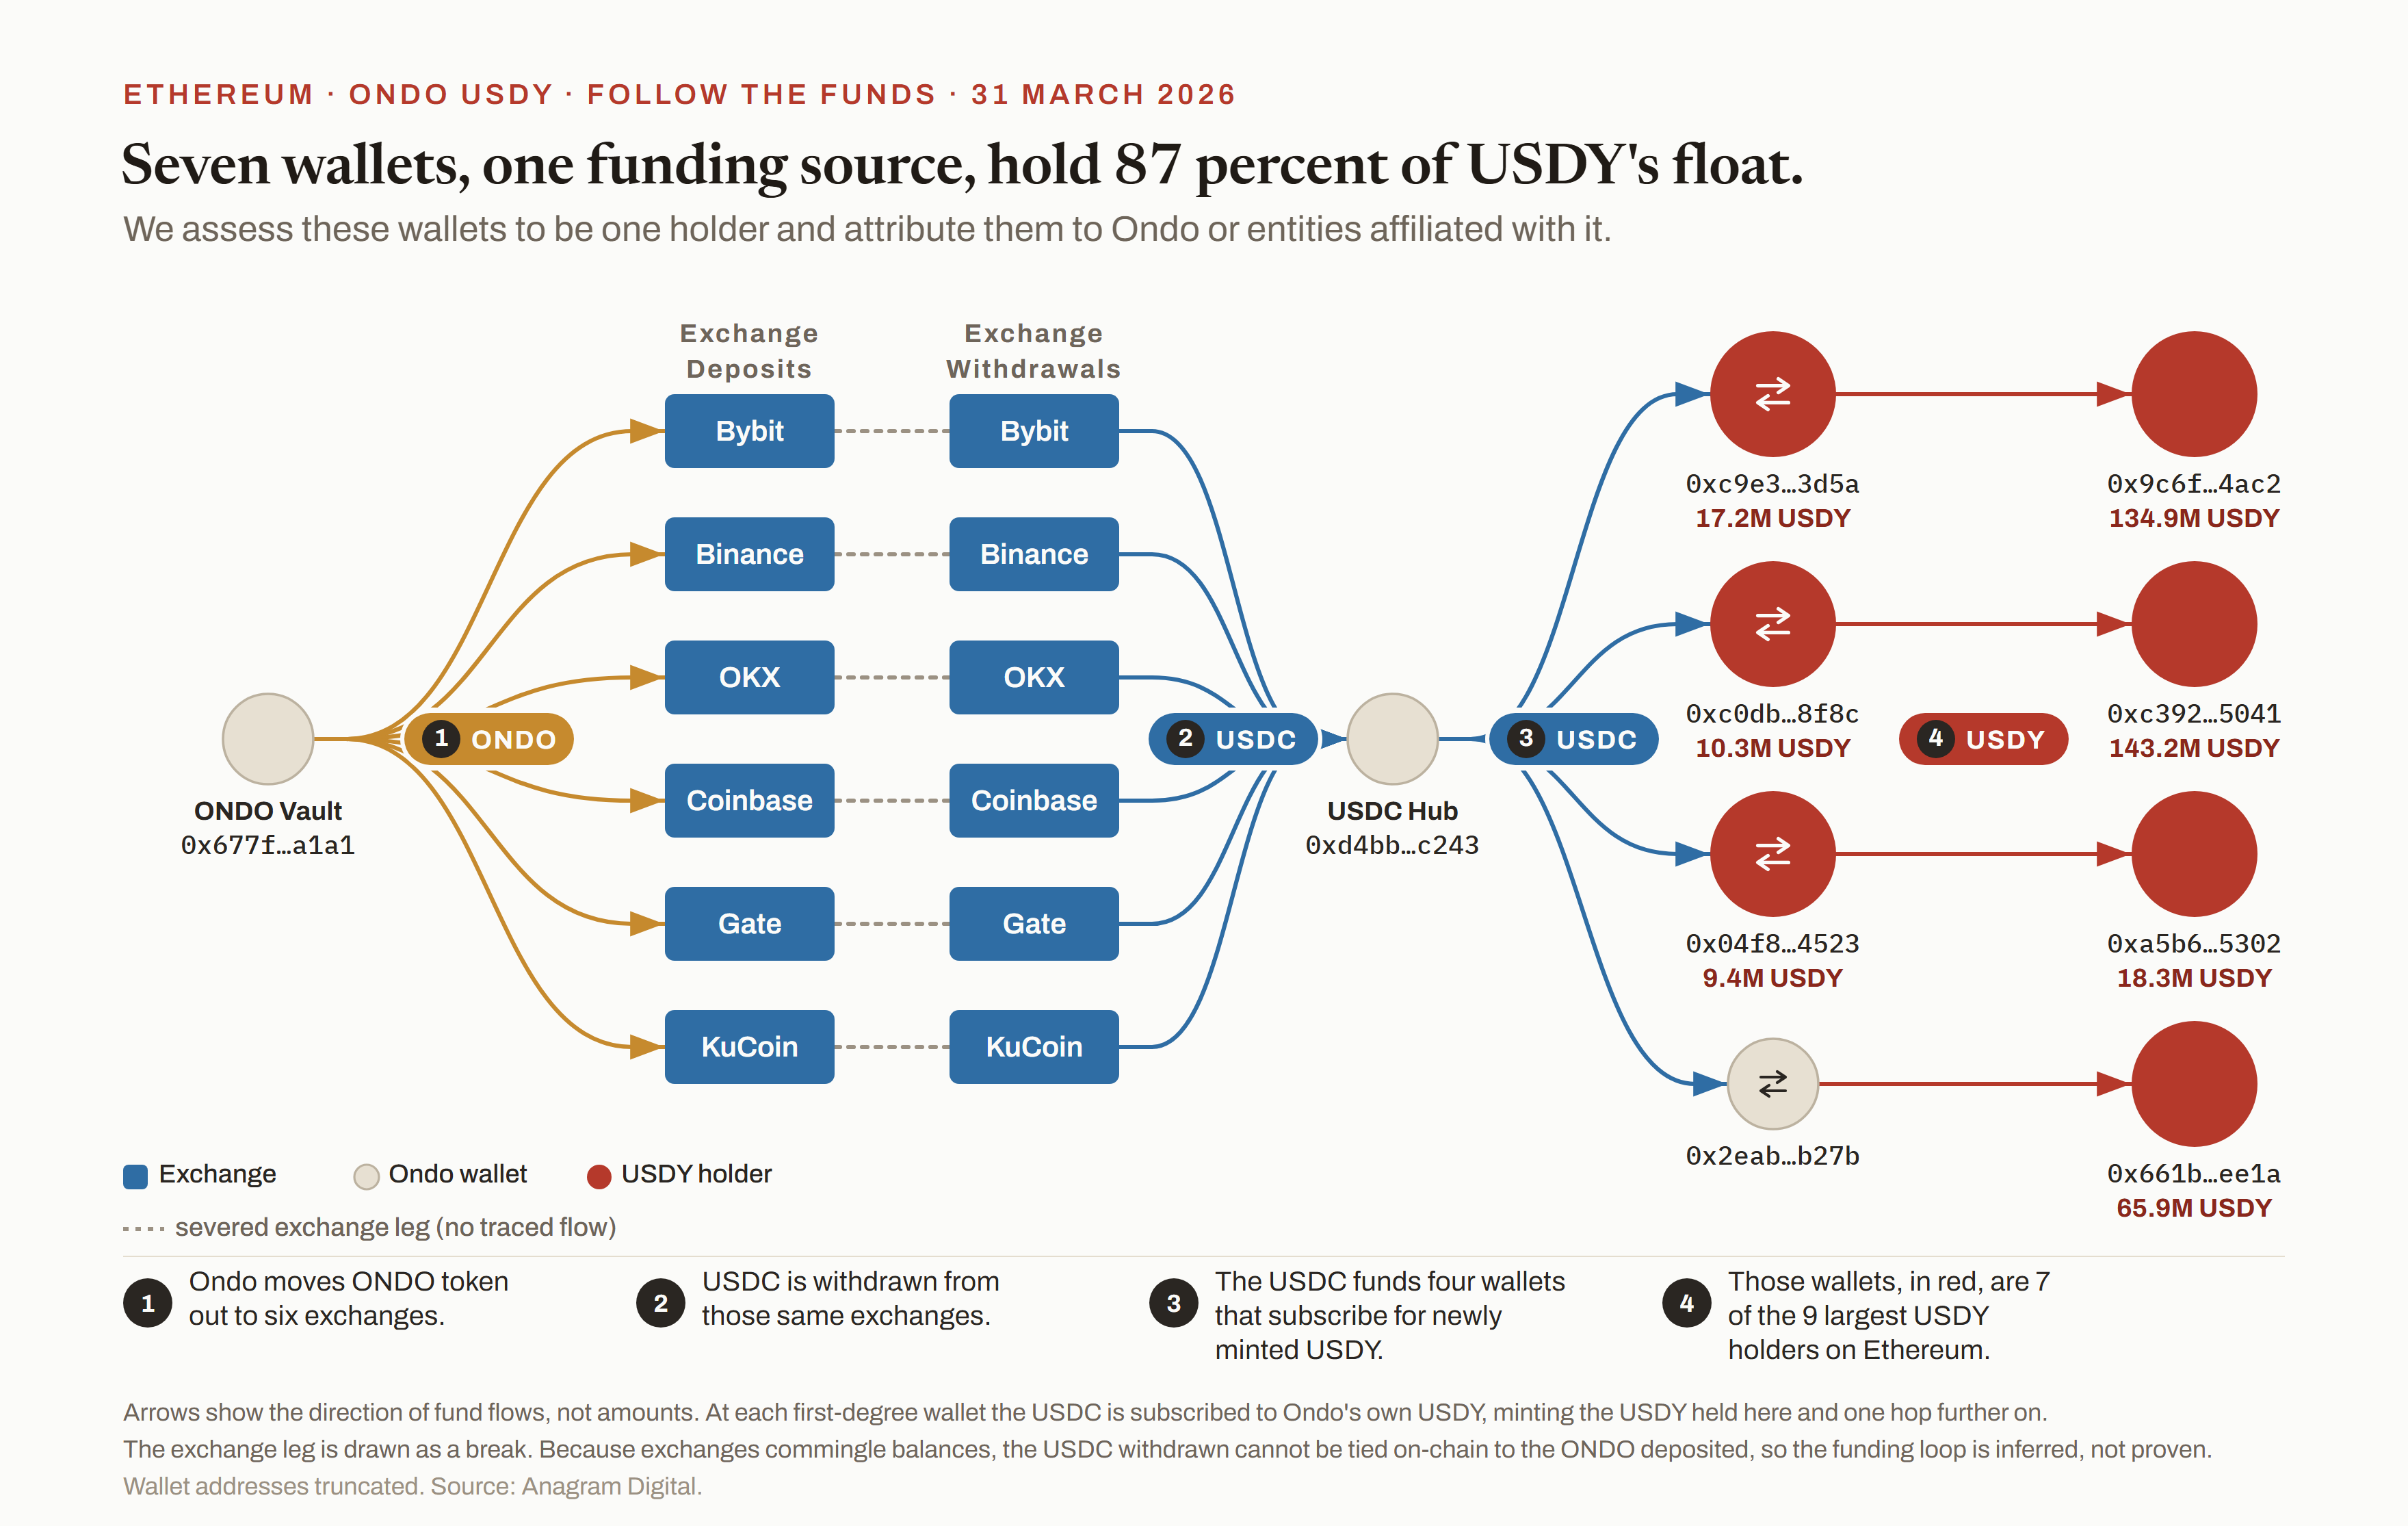
We attribute 85 percent of USDY’s circulating float on Ethereum to Ondo or entities affiliated with it. The analysis behind this figure is presented in full in Section 6.
The evidence points to Ondo or its affiliates
Several independent threads tie these wallets to Ondo, the issuer of USDY, or to entities affiliated with it. Some connect to wallets Ondo has itself disclosed. Value flows one way out of them into wallets we attribute to Ondo. The multi-signature custody setup matches Ondo's own.
And the dollars that funded the purchases were withdrawn from the same handful of exchanges into which Ondo's treasury had been depositing its ONDO governance token. That last link cannot be proven on-chain, because exchanges pool everyone's money together, and the chart marks it as a break for that reason. Taken together these threads point, with high confidence, to Ondo or entities closely affiliated with it.
What it means, and what we are not saying
There are ordinary reasons an issuer might hold its own token at scale. Some of this balance may be unsold inventory, custodial or bridge holdings, or liquidity the issuer is seeding in its own market rather than an absence of outside demand. We are not alleging wrongdoing, and the point here is the market, not the conduct.
What the data shows is plain: 85 percent of the circulating float of one of tokenization's flagship assets sits in wallets we assess to be controlled by the issuer or its affiliates, not with outside buyers. We call that share the self-held float: the portion of circulating float sitting in wallets linked to the issuer or its affiliates rather than in independent hands. It is the most extreme version of the pattern this section describes, and none of it is visible in a headline total.
Outside money, pooled off the chain
The second region is a different thing entirely
About $2.08 billion of it is not the issuers' own money. It is outside investors pooled in custodial, or omnibus, wallets the issuer or its tokenization platform operates on their behalf. Standard Chartered's Libeara platform pools outside fund investors this way, and WisdomTree pools retail buyers of its tokenized funds the same way. This is genuine outside demand. The largest of these pooled wallets, Libeara’s $706 million, is worked in full in Section 6.
But it is demand for the asset, not for the tokenization
These buyers never hold the token themselves, so they cannot move it, self-custody it, or use it anywhere on-chain. WisdomTree, by its own description, keeps the blockchain entirely invisible to its retail users.
The benefits tokenization is meant to deliver are exactly the ones a pooled holder does not receive. The clearest exception is reach. Platforms like Libeara use tokenization to offer assets across borders to investors who would otherwise struggle to access them,2 a real advantage even when the holding stays pooled. For most of this segment, though, the tokenization is back-office plumbing the buyer never touches.
So the honest gauge is smaller than the headline
That is the $8.61 billion line: independently held, on-chain, by the owner. A meaningful part of even that is crypto-native demand, tokenized cash parked by on-chain businesses, rather than traditional capital moving in.3 The headline counts the industry's own inventory and its off-chain custody alongside genuine adoption. Separating them is the only way to see how much of each there is.
Issuer-affiliated wallets are those operated by an RWA issuer, its tokenization platform, or an entity closely affiliated with it. They cover both the issuer's own holdings (treasury, operational and deployer addresses, unsold inventory, and tokens held to back its own other tokens) and omnibus custody the issuer or its platform runs for outside clients. The two are reported separately, and omnibus holdings are treated as outside demand rather than as the issuer's own. The Ondo USDY attribution rests on common funding through a single hub together with multiple independent links to known Ondo wallets, set out in full in Section 6. We hold it with high confidence for the on-chain control and treat the link to ONDO token sales as consistent but unproven, since it runs through pooled exchange balances. Figures as of 31 March 2026. Source: Anagram Digital.
Finding 02 · Composability
Measuring composability as an indicator of adoption
Still small, but broad and growing
Composability, using a token as a building block inside other on-chain systems, is the one advantage tokenization offers with no traditional equivalent. Tokens carrying about two-thirds of the market's value have touched DeFi, though for most the contact looks like early experimentation. The fraction used in earnest is small but growing fast, across every kind of asset.
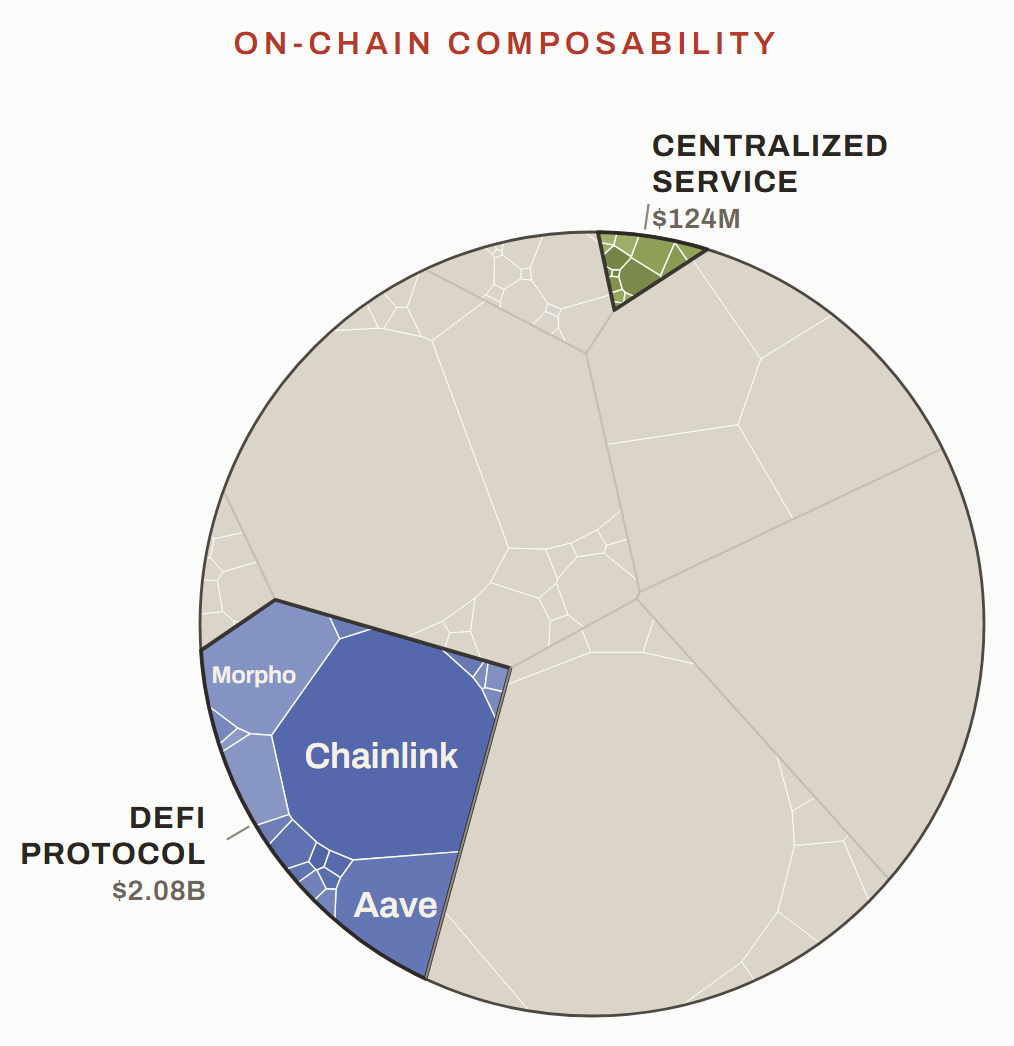
Composability is the cleanest test of whether tokenization delivers something new
A holder can post a token as collateral, lend it, trade it, or plug it into an automated strategy, without asking permission and without taking the asset off the chain. Every other advantage this report tests has an off-chain approximation, liquidity in a secondary market, broader access in a feeder fund. Composability has none.
A Treasury bill in a brokerage account cannot be pledged as collateral in an unrelated venue in the middle of the night. A tokenized Treasury bill can. If these assets are widely used this way, that is real adoption. If they mostly sit still, the tokenization is closer to form than function.
We measure composability by DeFi flow, not by holdings
A trading pool can hold almost nothing while turning over enormous volume, and a reserve can hold billions while doing nothing but back something else, so we measure the volume of RWA tokens actually moving through DeFi venues and exclude assets held as passive backing. Backing is a holding, not a use.
Measuring it this way has a steep prerequisite. Telling a first hop from an interior one means classifying every address these tokens touch and naming the venues, so the measure rests on the same attribution layer as the holder map, extended across the 130 DeFi protocols these tokens interact with. Without that map, the same activity would be counted several times over.
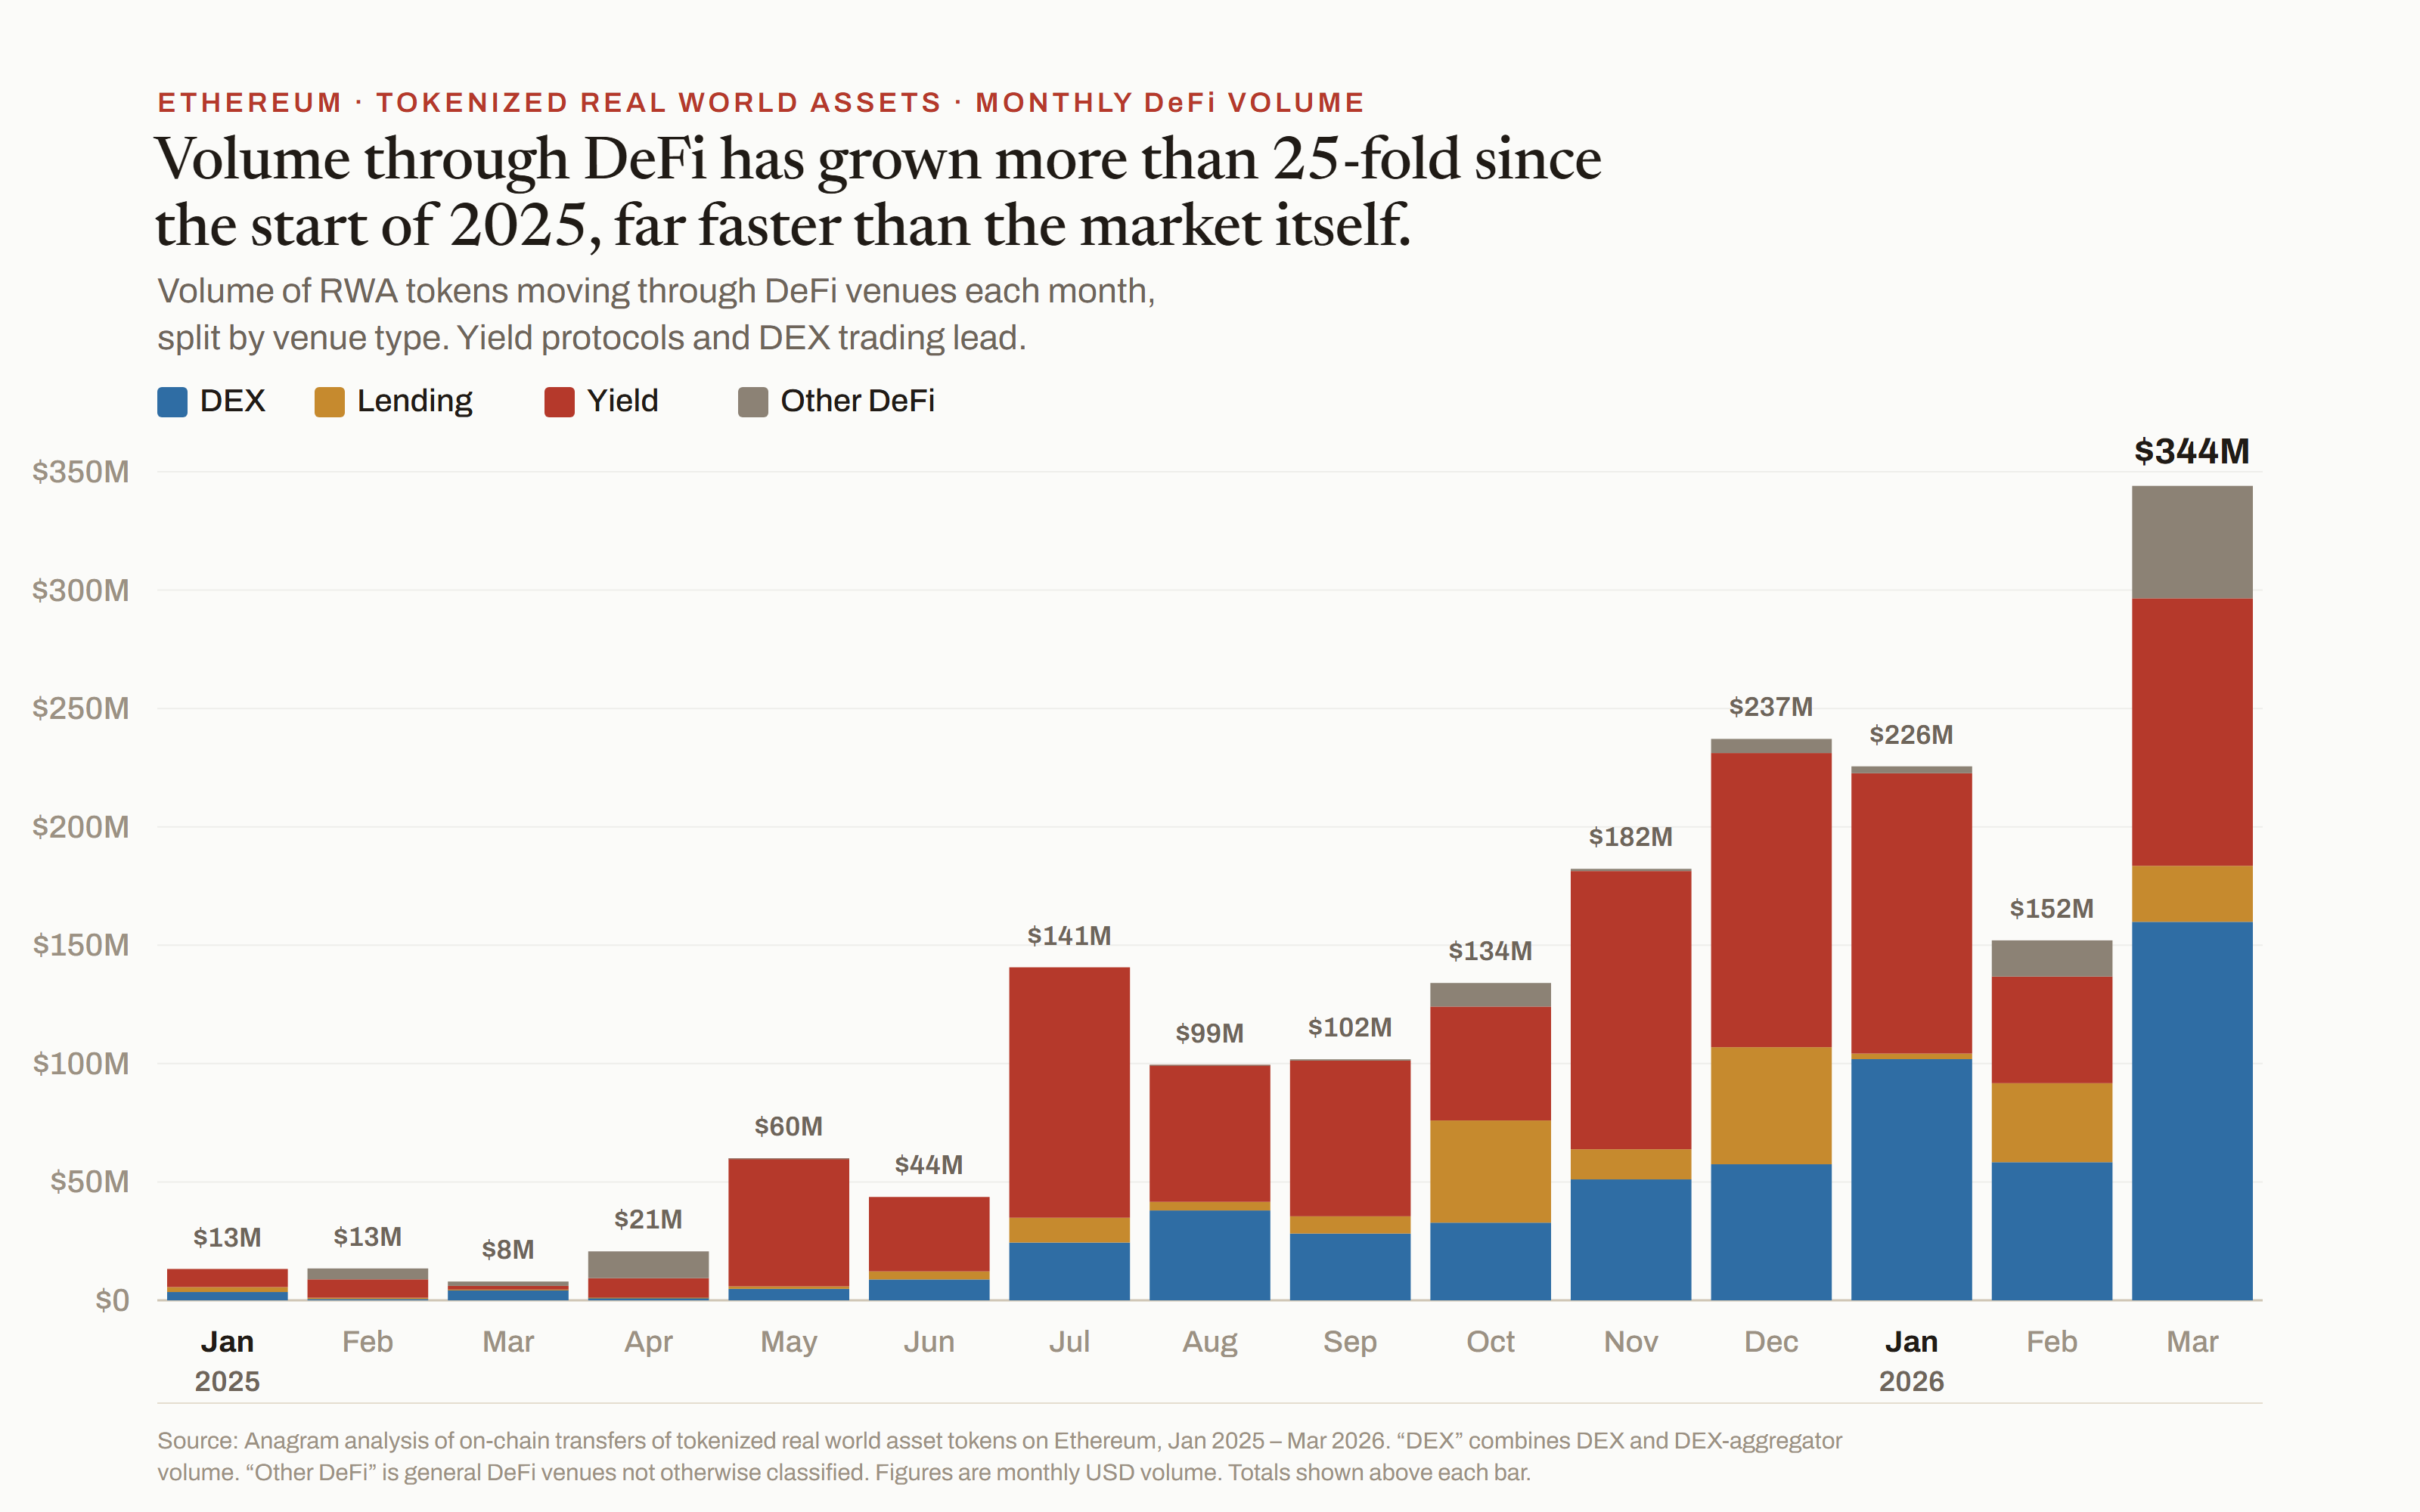
Touching DeFi is common, using it in earnest is not
The 208 tokens (of 418) that have interacted with a DeFi protocol at least once carry about 68 percent of the market's value, and the experimentation spans every asset type. But for most the contact is a handful of transfers, often one-off tests: 186 of those 208 have under $100,000 of lifetime DeFi volume apiece. Genuine, repeated use is the work of a few names. Five tokens are 91 percent of all DeFi volume, and two Maple credit tokens alone are about 60 percent of it.
The part that is used is growing fast, up 26-fold in fifteen months
Volume through DeFi has scaled from about $13 million a month at the start of 2025 to $344 million in March 2026. Over the same window the outstanding balance of RWAs grew about 3.8-fold, so each dollar of RWA is being put to work in DeFi far more than it used to be.
And the testing is not confined to one corner. The tokens carrying real dollar volume are mostly crypto credit and a few short-term treasury funds, but the long tail of small and first-time DeFi transfers runs across treasuries, credit, funds, and tokenized equities alike. The honest read is an early market testing widely and using narrowly, with the trend pointing up on both.
What is driving the growth
The activity is what any liquid asset is used for, now done on-chain without a gatekeeper. RWA tokens are traded on decentralized exchanges (Uniswap), pledged as collateral (Aave), managed by curated vaults that act as on-chain funds (Morpho), and split into principal and yield components (Pendle). None of these uses is large yet, but each is an RWA doing something its traditional form cannot. A meaningful share of the lending is recursive leverage looping, a position pledged, borrowed against, and redeposited to multiply exposure, which lifts these volumes and concentrates risk in a way we return to at the end of the report.4
Centralized venues, too
The same property is at work when these tokens move onto centralized rails. Exchanges, lending desks, and trading firms hold about $124 million of them, standing balances rather than flow, small next to the asset base but a second place these assets do something their traditional form cannot.
DeFi volume is the USD value of in-scope RWA tokens moving into DeFi venues (DEX and aggregators, lending, yield, and other DeFi), January 2025 to March 2026, counted as the first transfer from a non-DeFi wallet into a protocol so that multi-hop activity is not double-counted. Assets held as passive backing are excluded. Breadth counts a token as having touched DeFi if any in-scope transfer reached a DeFi protocol. Asset profiles (private markets, money markets, and public equity) come from the master token list. Centralized-venue figures are standing balances. Full sources and methodology in appendix. Source: Anagram Digital.
Finding 03 · Liquidity
Liquidity for assets that usually have none
A handful of cash-like tokens turn over fast. The assets that are actually illiquid barely trade.
Tokenization's promise here is liquidity for assets that are hard to sell: private credit, fund stakes, real estate. On-chain, that promise is mostly unmet. The headline turnover, close to 30 percent of the private-markets base a month, is almost entirely a few cash-like tokens designed for on-demand redemption. The genuinely illiquid assets barely trade, and outside those few tokens the secondary market tokenization is supposed to create is essentially nonexistent.
Five tokens carry nearly all the liquidity. The other forty-one are as illiquid as their traditional counterparts.
This finding is only about private markets, the $4.71 billion where the underlying asset is genuinely hard to sell. Treasuries and public equities are already liquid, so tokenizing them adds around-the-clock access but no real breakthrough. In traditional form these private assets lock investors in for years: secondary stakes turn over about 2 percent of value a year, and the vehicles built to offer an exit cap redemptions near 2 percent a month. If tokenization delivers liquidity anywhere, it should be here, and at the headline level it looks delivered, with close to 30 percent of the base redeemed or sold on-chain every month. That average does not survive a look at which tokens are doing it.
Tokenized private markets · Monthly turnover by token · 31 March 2026
The turnover is a few tokens, not the asset class
| Token | Manager · Platform | Asset type | Asset base | Redemption /mo | Secondary /mo | Turnover /mo |
|---|---|---|---|---|---|---|
| syrupUSDC | Maple | Crypto credit | $1.82b | 27% | 4% | $0.56b |
| syrupUSDT | Maple | Crypto credit | $1.00b | 37% | 3% | $0.40b |
| JAAA | Janus Henderson · Centrifuge | Real-economy credit | $0.14b | 158% | 0% | $0.22b |
| USCC | Superstate | Hedge fund | $0.15b | 60% | 0% | $0.09b |
| RLP | Resolv | Hedge fund | $0.04b | 157% | 2% | $0.06b |
| These five (cash-like) | $3.15b | 39% | 3% | $1.33b | ||
| All other private markets (41 tokens) | $1.56b | 2.5% | <0.1% | $0.04b | ||
| All private markets | $4.71b | 27% | 2% | $1.37b |
The turnover is cash-like tokens, not the asset class
Five tokens, Maple's syrupUSDC and syrupUSDT, Janus Henderson's JAAA (tokenized on Centrifuge), Superstate's USCC, and Resolv's RLP, are two-thirds of the private-markets base and account for essentially all of the turnover. They redeem about 39 percent of their value a month, two of them more than 100 percent, which is not an illiquid asset being unlocked but a cash-like instrument being parked and pulled.
Strip the five out and tokenized private markets are no more liquid than traditional ones
The remaining 41 tokens, $1.56 billion of more traditional private assets, redeem about 2.5 percent of their value a month, the range of a traditional interval fund or non-traded REIT. Their secondary trading is $0.16 million a month across all 41, with only three trading at all. The largest does not move: BCAP, $757 million of tokenized venture capital and the sixth-largest token in this report, turns over zero.
What is new is the exit rail, not a market
We count the ways out, redemption to the issuer and sale to another buyer, because for an illiquid asset liquidity is the ease of getting out. The on-chain redemption rail genuinely works, around the clock and on demand, faster than any traditional structure allows. But the distinctive thing tokenization is supposed to add, a secondary market where illiquid assets change hands between buyers, has not appeared outside those few tokens.5
Where a secondary market exists at all, it is thin and pricing can stray far from NAV
One token in this set, sAID, a tokenized specialty-finance credit fund, is among the very few illiquid RWAs with any secondary trading, and isolated trades printed as low as 30 percent of NAV. Most trades clear much closer, and prints that low come from a book of a handful of trades rather than a sustained level. They are still a reminder of what a functioning exit is worth when the market for it is this thin.
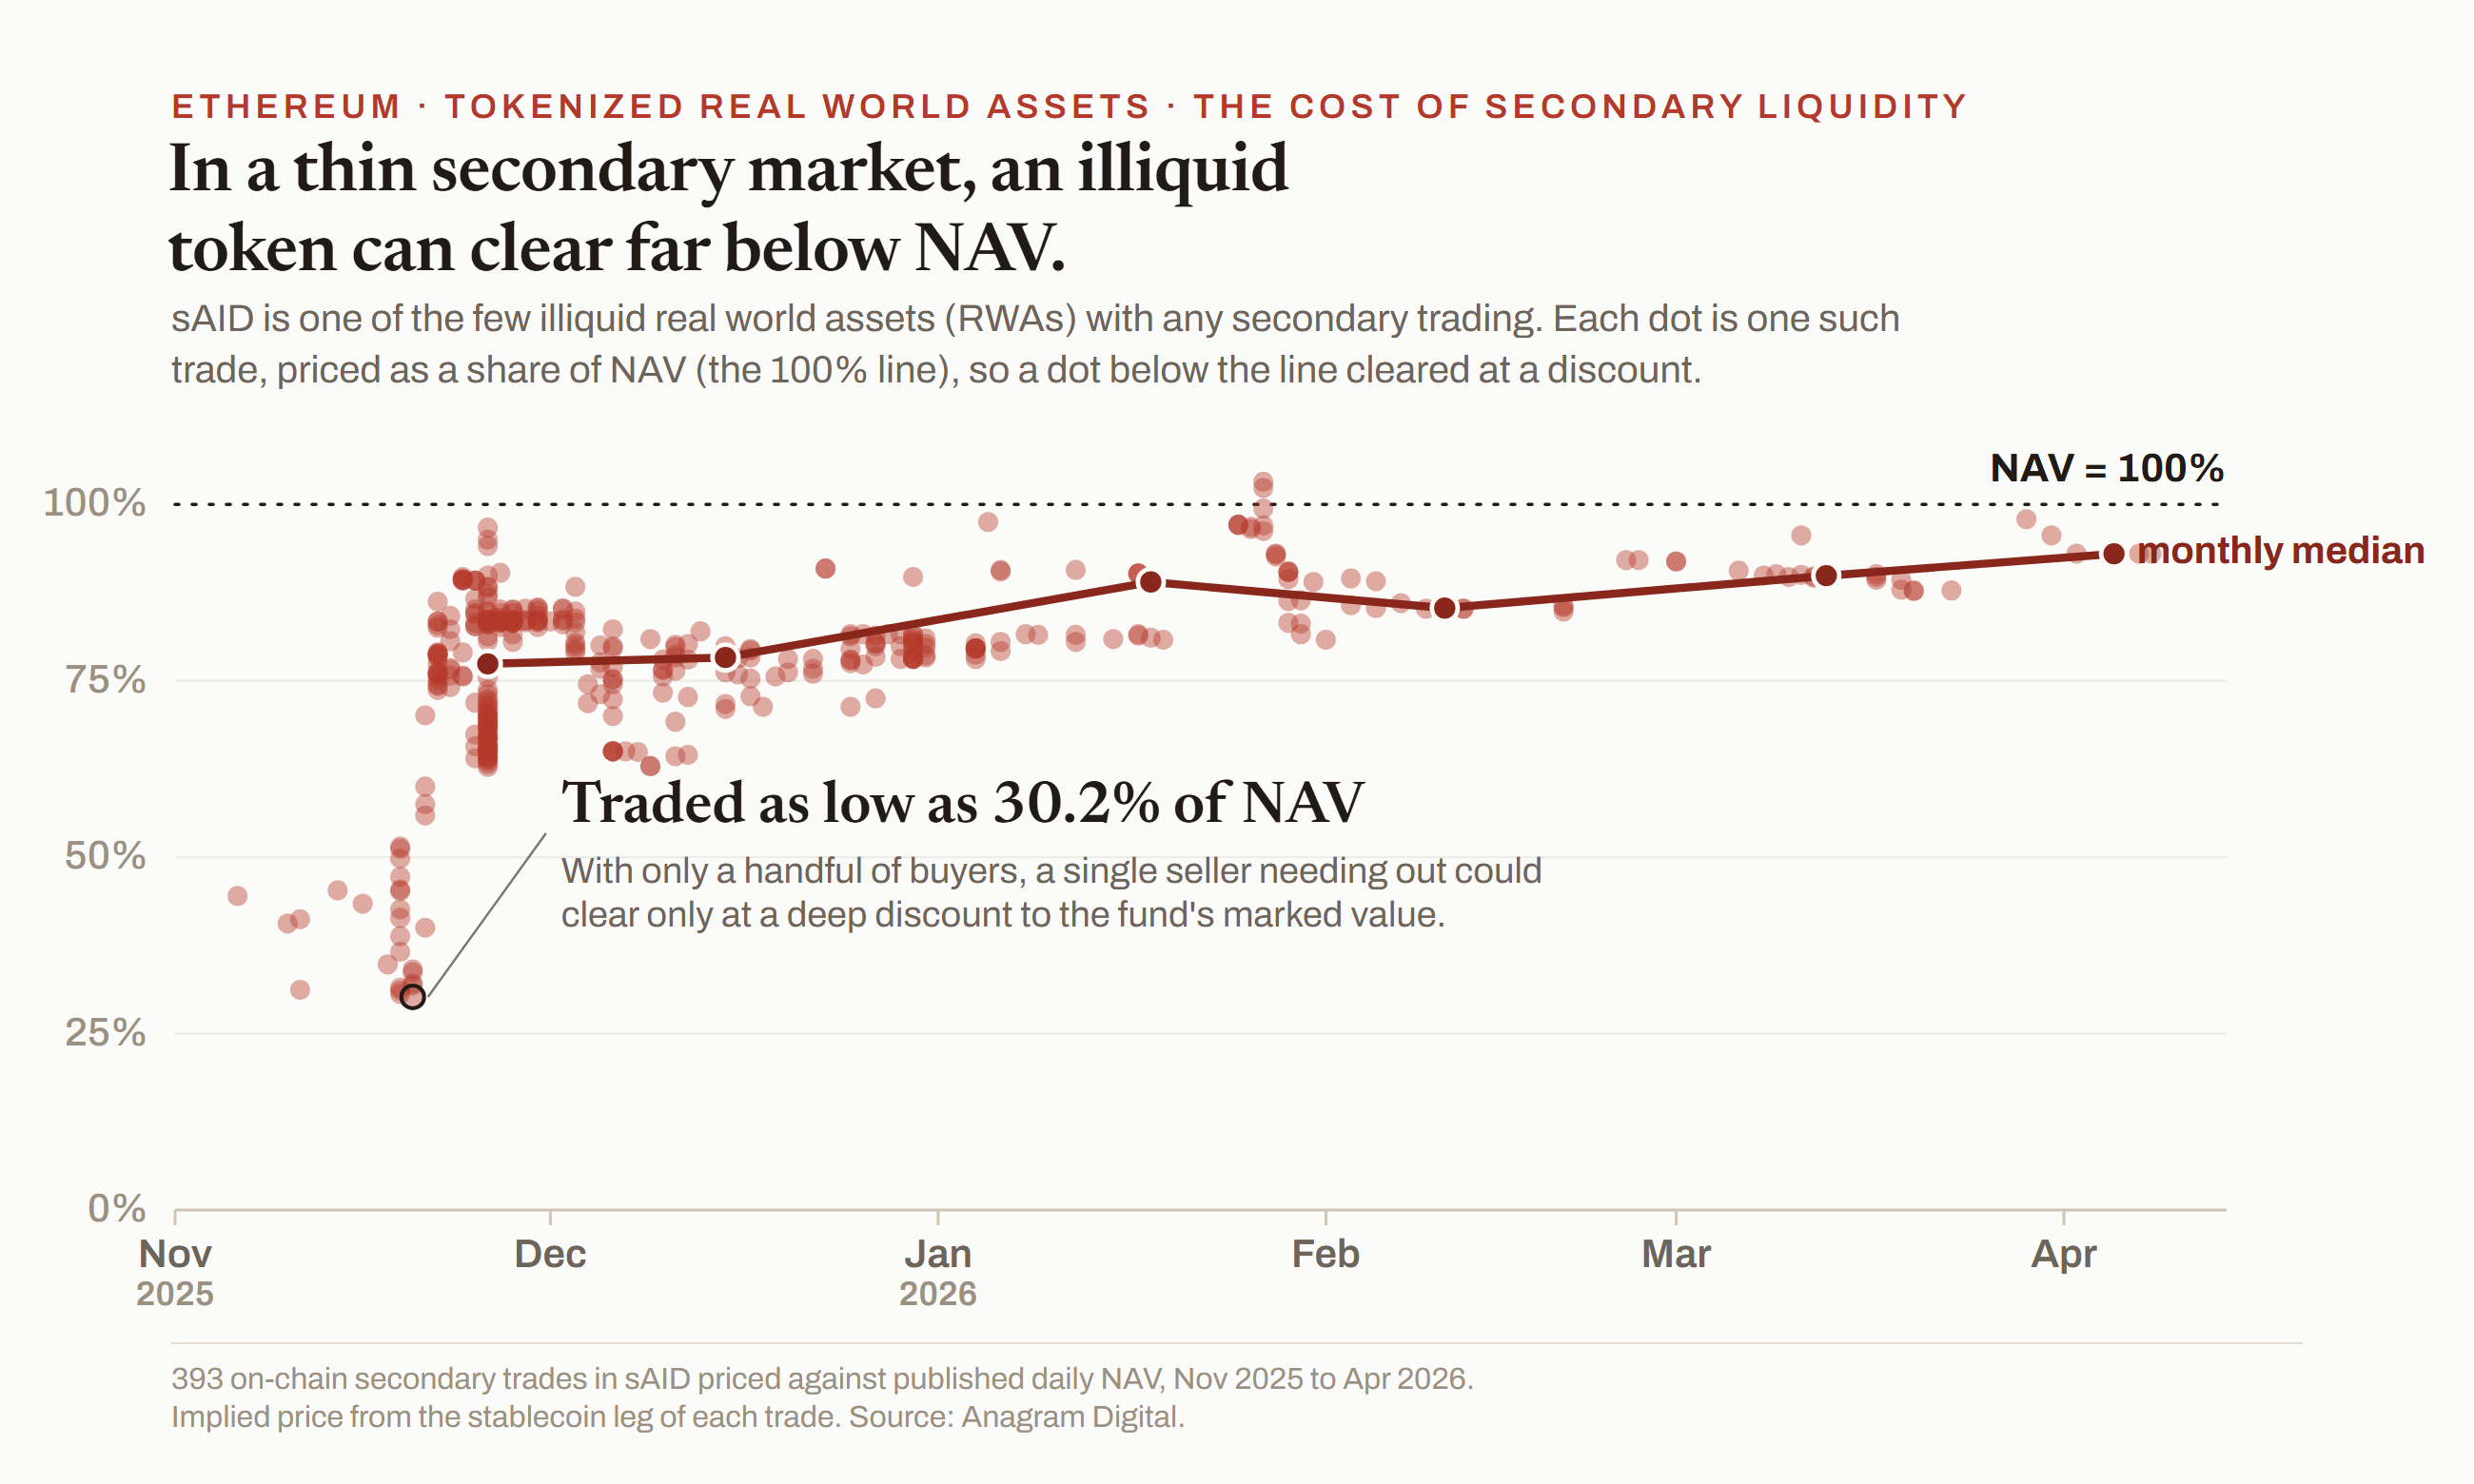
Liquidity only for the cash-like
For the assets the promise is about, tokenized venture capital, real estate, and lock-up private credit, the redemption on offer is no better than a traditional fund's and a secondary market has not formed. One caution survives: the redemption door that lets cash-like tokens be pulled on demand in calm conditions can carry a rush for the exit in stressed ones, faster than any traditional structure would.6
Scope is tokenized private markets on Ethereum (private credit, fund LP stakes, and real estate). Treasuries and public equities are excluded as already liquid in traditional form. Liquidity is measured as monthly exits, redemptions to the issuer plus secondary sales on DEX and OTC venues, as a share of the outstanding private-markets asset base, shown as a trailing 3-month average to March 2026 over a $4.71 billion base. Traditional benchmarks: PE and fund LP secondaries at about 2.1 percent of NAV a year, non-traded REIT redemptions capped near 2 percent a month and gated under stress, and private credit interval funds at about 5 percent a quarter after a one-year lockup. Secondary-price data is 393 on-chain trades of sAID priced against its published daily NAV. Full sources and methodology in appendix. Source: Anagram Digital.
Finding 04 · Programmability
Programmability and on-chain compliance
Restricted securities are not supposed to move this freely.
In a simulated test, we tried to send every tokenized asset to a wallet on the US sanctions list. For about $3.3 billion of them, 28 tokens that carry no on-chain restriction at all, the transfer went through. Programmability promises that compliance can be built into the token, yet just over half the value is gated to approved holders while five in six tokens never check who is eligible to hold them. We are flagging a structural gap here, not asserting that any token has broken the law.
Compliance is where programmability meets a hard legal line
The pitch is that a tokenized security can carry its own rulebook, eligibility and transfer restrictions written into the contract, so an ineligible transfer simply fails. Regulators have been emphatic that the wrapper changes nothing. "Tokenized securities are still securities," SEC Commissioner Hester Peirce has written, because blockchain "does not have magical abilities to transform the nature of the underlying asset."7 SEC Chairman Paul Atkins put it more bluntly: "Economic reality trumps labels."8 But a traditional security never enforced its own restrictions. Registered intermediaries did. A token can pass from wallet to wallet with no intermediary in between, which raises the question this section tests: when it moves on its own, what keeps the restriction in force?
We identified each token's enforcement model empirically, by testing transfers on-chain
Using Tenderly, we simulated multiple transfers per token, to and from arbitrary addresses and addresses on the OFAC sanctions list, and watched which clear and which revert.9 That sorts the market into three models.
A gated token (a whitelist) blocks every transfer unless the receiving address has been approved. This is the model built for regulated securities and standardized in ERC-3643,10 the permissioned-token standard the SEC chair has pointed to as a template for compliant tokenization.
A blocklist token is weaker. It allows transfers freely but blocks any address the issuer has listed, sanctioned wallets among them. This is the sanctions-style screening US law now requires of stablecoin issuers under the GENIUS Act.11 It is a sanctions screen, not the control over who may hold the asset that a security calls for.
An open token carries no on-chain restriction at all. Whatever eligibility the issuer checks happens off-chain at the point of sale, and once the token is issued nothing in it stops the buyer from passing it to anyone.
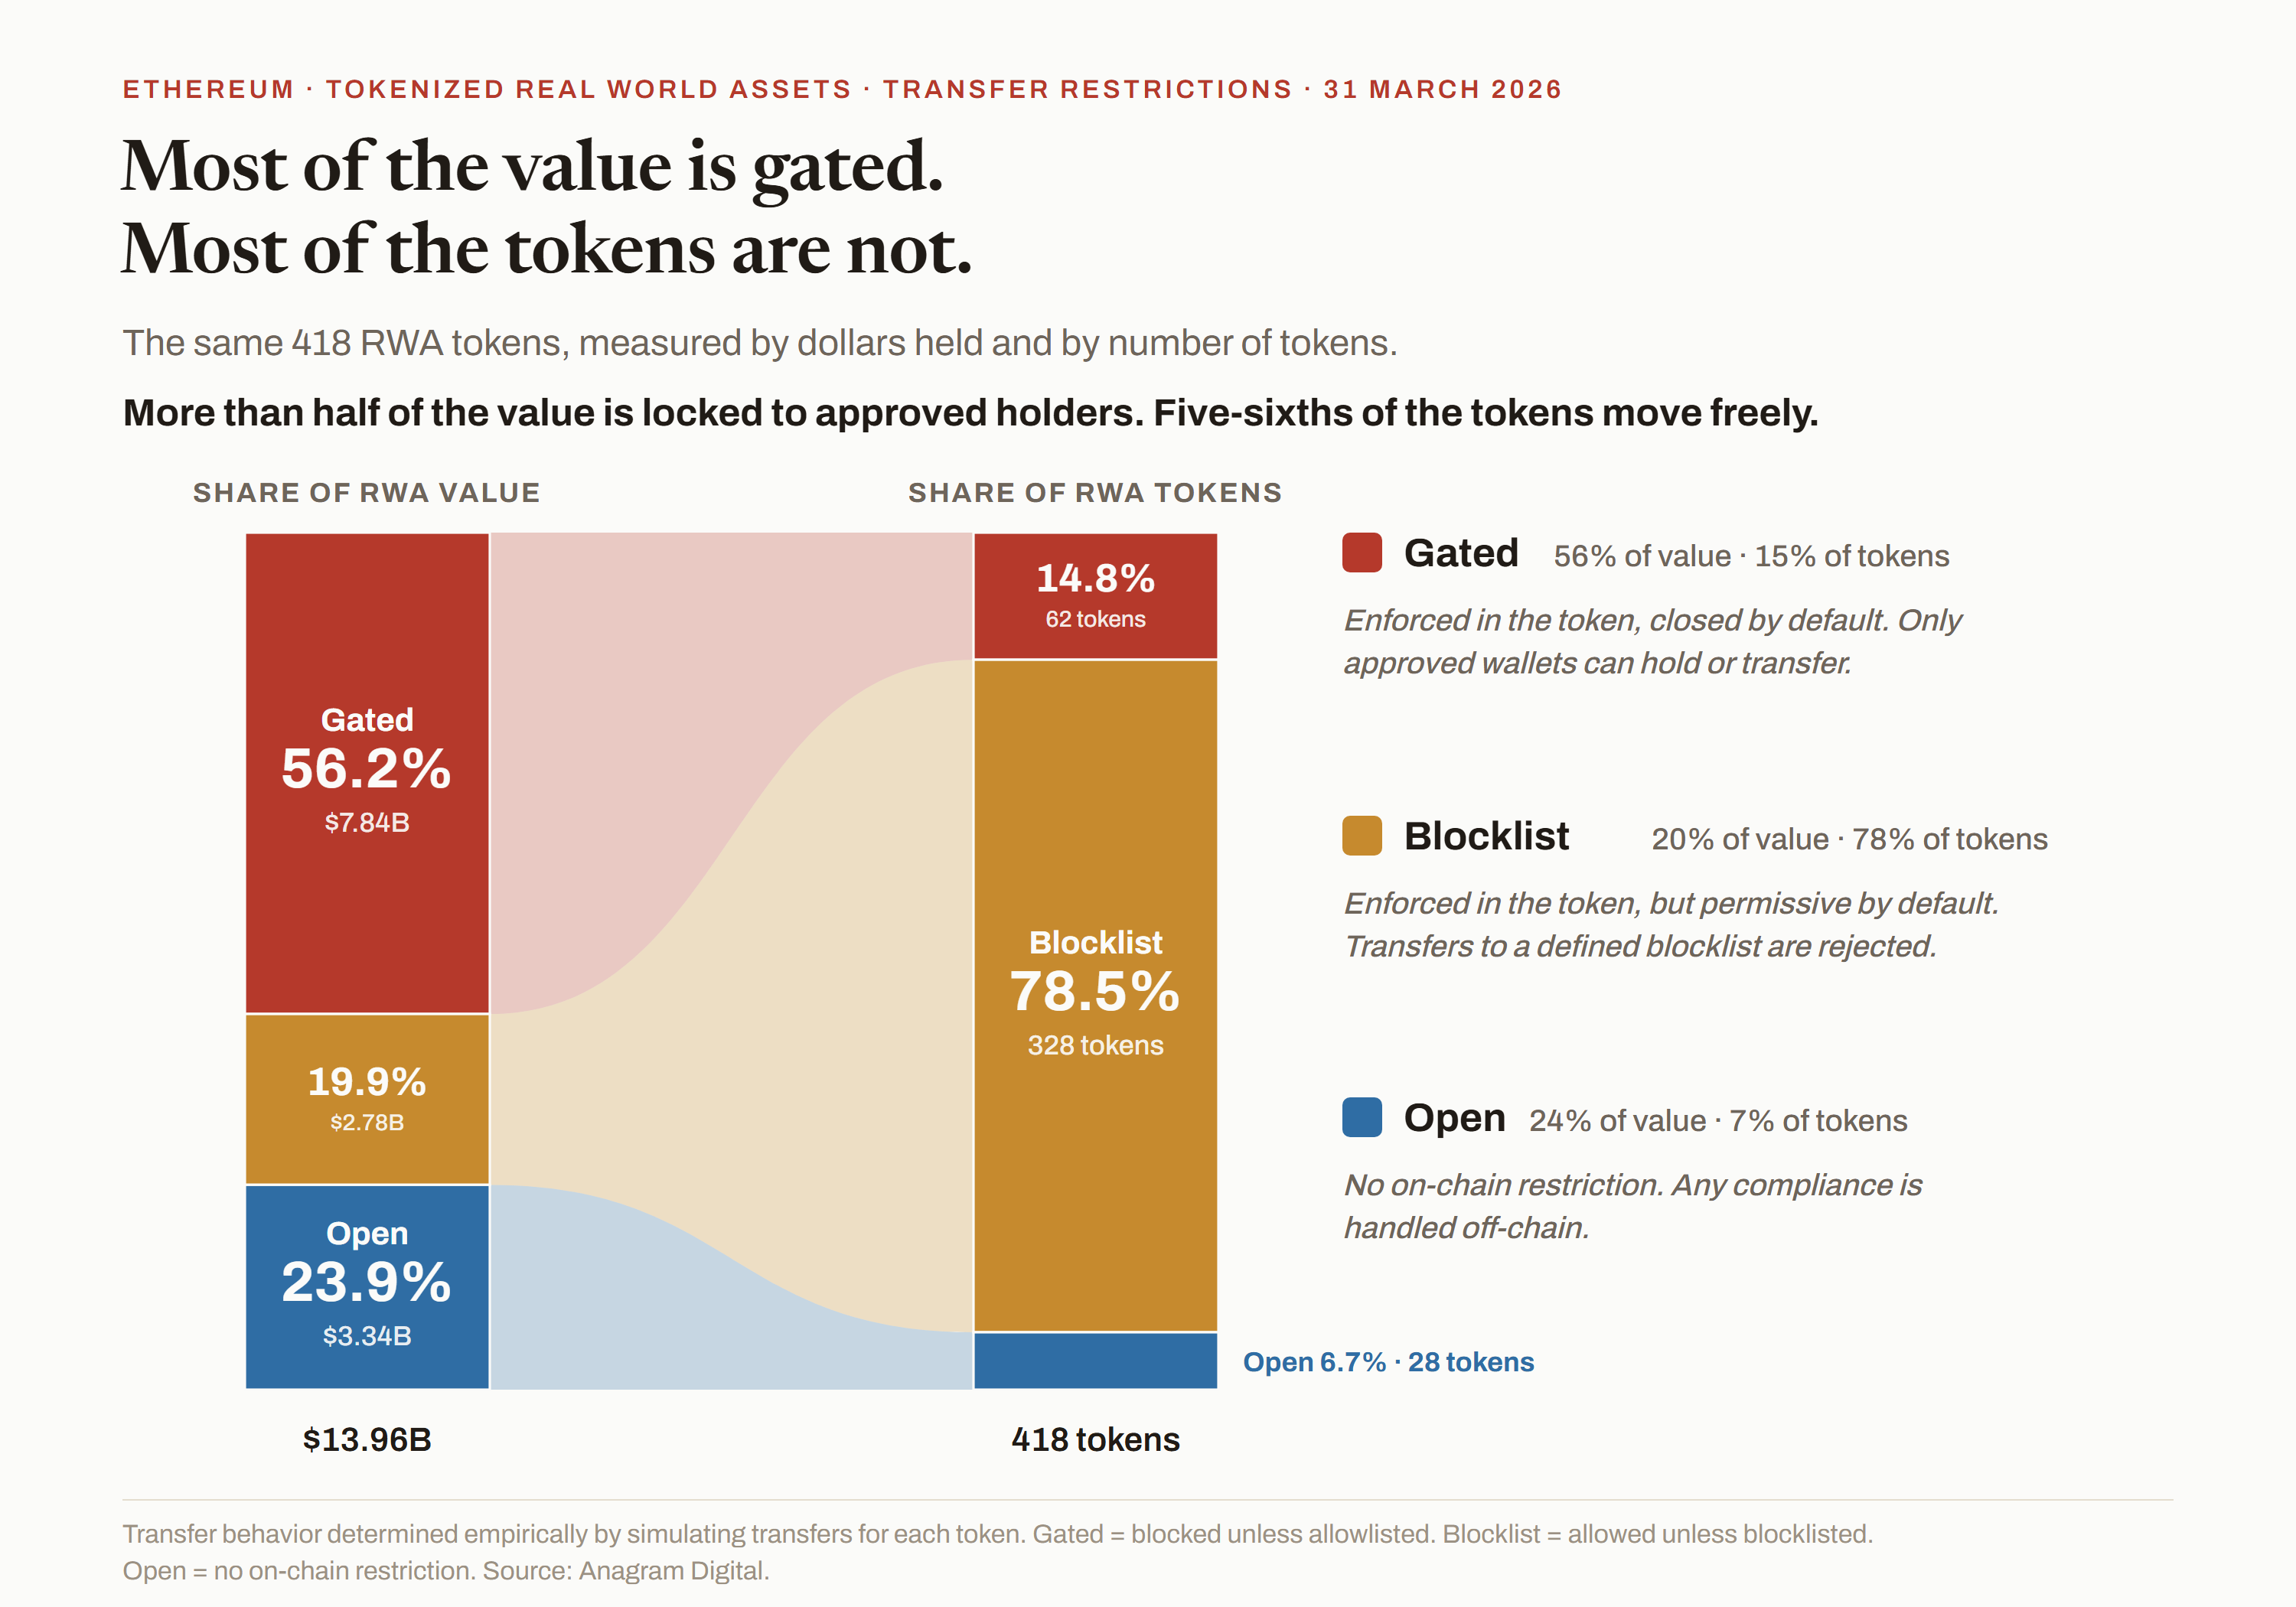
Only the gated tokens vet for eligible holders. The other five in six do not. And the most open, about $3.3 billion worth, would transfer even to a sanctioned wallet in a simulated test.
Just over half the value is gated, but five in six tokens are not
Gated tokens hold 56 percent of the value, the large institutional funds whose compliance teams require that only vetted wallets hold the asset. By count, 85 percent of tokens are not gated at all, the long tail of tokenized equities and DeFi-native credit almost anyone can hold. So whether programmable compliance is real depends on what you count. For most of the money, it is real and enforced in code. For most of the tokens, the rulebook, if there is one, sits off-chain.
Most of these tokens never check who is eligible to hold them
In the simulations, the gated tokens refused any recipient that was not pre-approved. The blocklist tokens blocked only the sanctioned addresses. The open tokens, about $3.3 billion worth, let everything through, screening nothing at all, not even an address sanctioned for terrorism financing.12 The open label describes a token's on-chain transfer behavior only. It is a structural property of the contract, not evidence that any issuer has failed a legal obligation, since for these tokens eligibility is screened off-chain at the point of sale rather than enforced in code.
$3.3 billion of tokenized assets carry no on-chain screen against a wallet sanctioned for terrorism financing. We tested it in simulation: no tokens moved. Whatever eligibility checks exist happen off-chain at the point of sale, not in the token.
Restricted securities are not supposed to move this freely
Securities sold under US exemptions can be held only by eligible investors and cannot be freely resold without another exemption.13 On-chain, only a gate written into the token or a registered intermediary standing in every trade can hold that line. The gated tokens have the first. The blocklist and open tokens have neither, and a sanctions screen is not an eligibility check. We are not lawyers, and the SEC itself has not said compliance must be coded in. It has set that question aside.14
Many of the open tokens are also tokenized non-US equities or DeFi-native credit whose securities status is genuinely contested, and we are flagging a structural gap, not asserting that any token has broken the law. Still, by the regulators' own standard, and only if these tokens are US securities, the large majority by token count would be moving more freely than the rules for restricted securities contemplate. The market is growing on a compliance question no one has answered. The last time digital assets scaled this fast on a question this open was the 2017 initial coin offering boom. The SEC found the tokens at issue were securities subject to the same laws,15 and a wave of enforcement followed.
Each token's transfer behavior was determined empirically by simulating multiple transfers with Tenderly, to and from arbitrary addresses and to and from OFAC-sanctioned addresses, and observing which revert.9 No tokens were actually transferred, and every transfer was run only in simulation. Gated means blocked unless the address is approved, blocklist means allowed unless the issuer blocks the sender or receiver, open means no on-chain restriction. Figures cover in-scope tokenized real world assets on Ethereum as of 31 March 2026, 418 tokens in all. Legal, regulatory, and standards sources are listed in the references. Full sources and methodology in appendix. Source: Anagram Digital.
Finding 05 · The compliance dividing line
One gate, three markets
The compliance model is the variable that explains the rest of the report
Read finding by finding, one variable keeps explaining the rest: the compliance model a token uses. It does not split the market in two. It sorts it into three. Gated tokens hold the value. Blocklist tokens hold the most small holders. Open tokens hold almost all the on-chain use. The breadth and the substance fall on different sides of different lines.
Where the value sits, the use does not. Where the use is, the value is not.
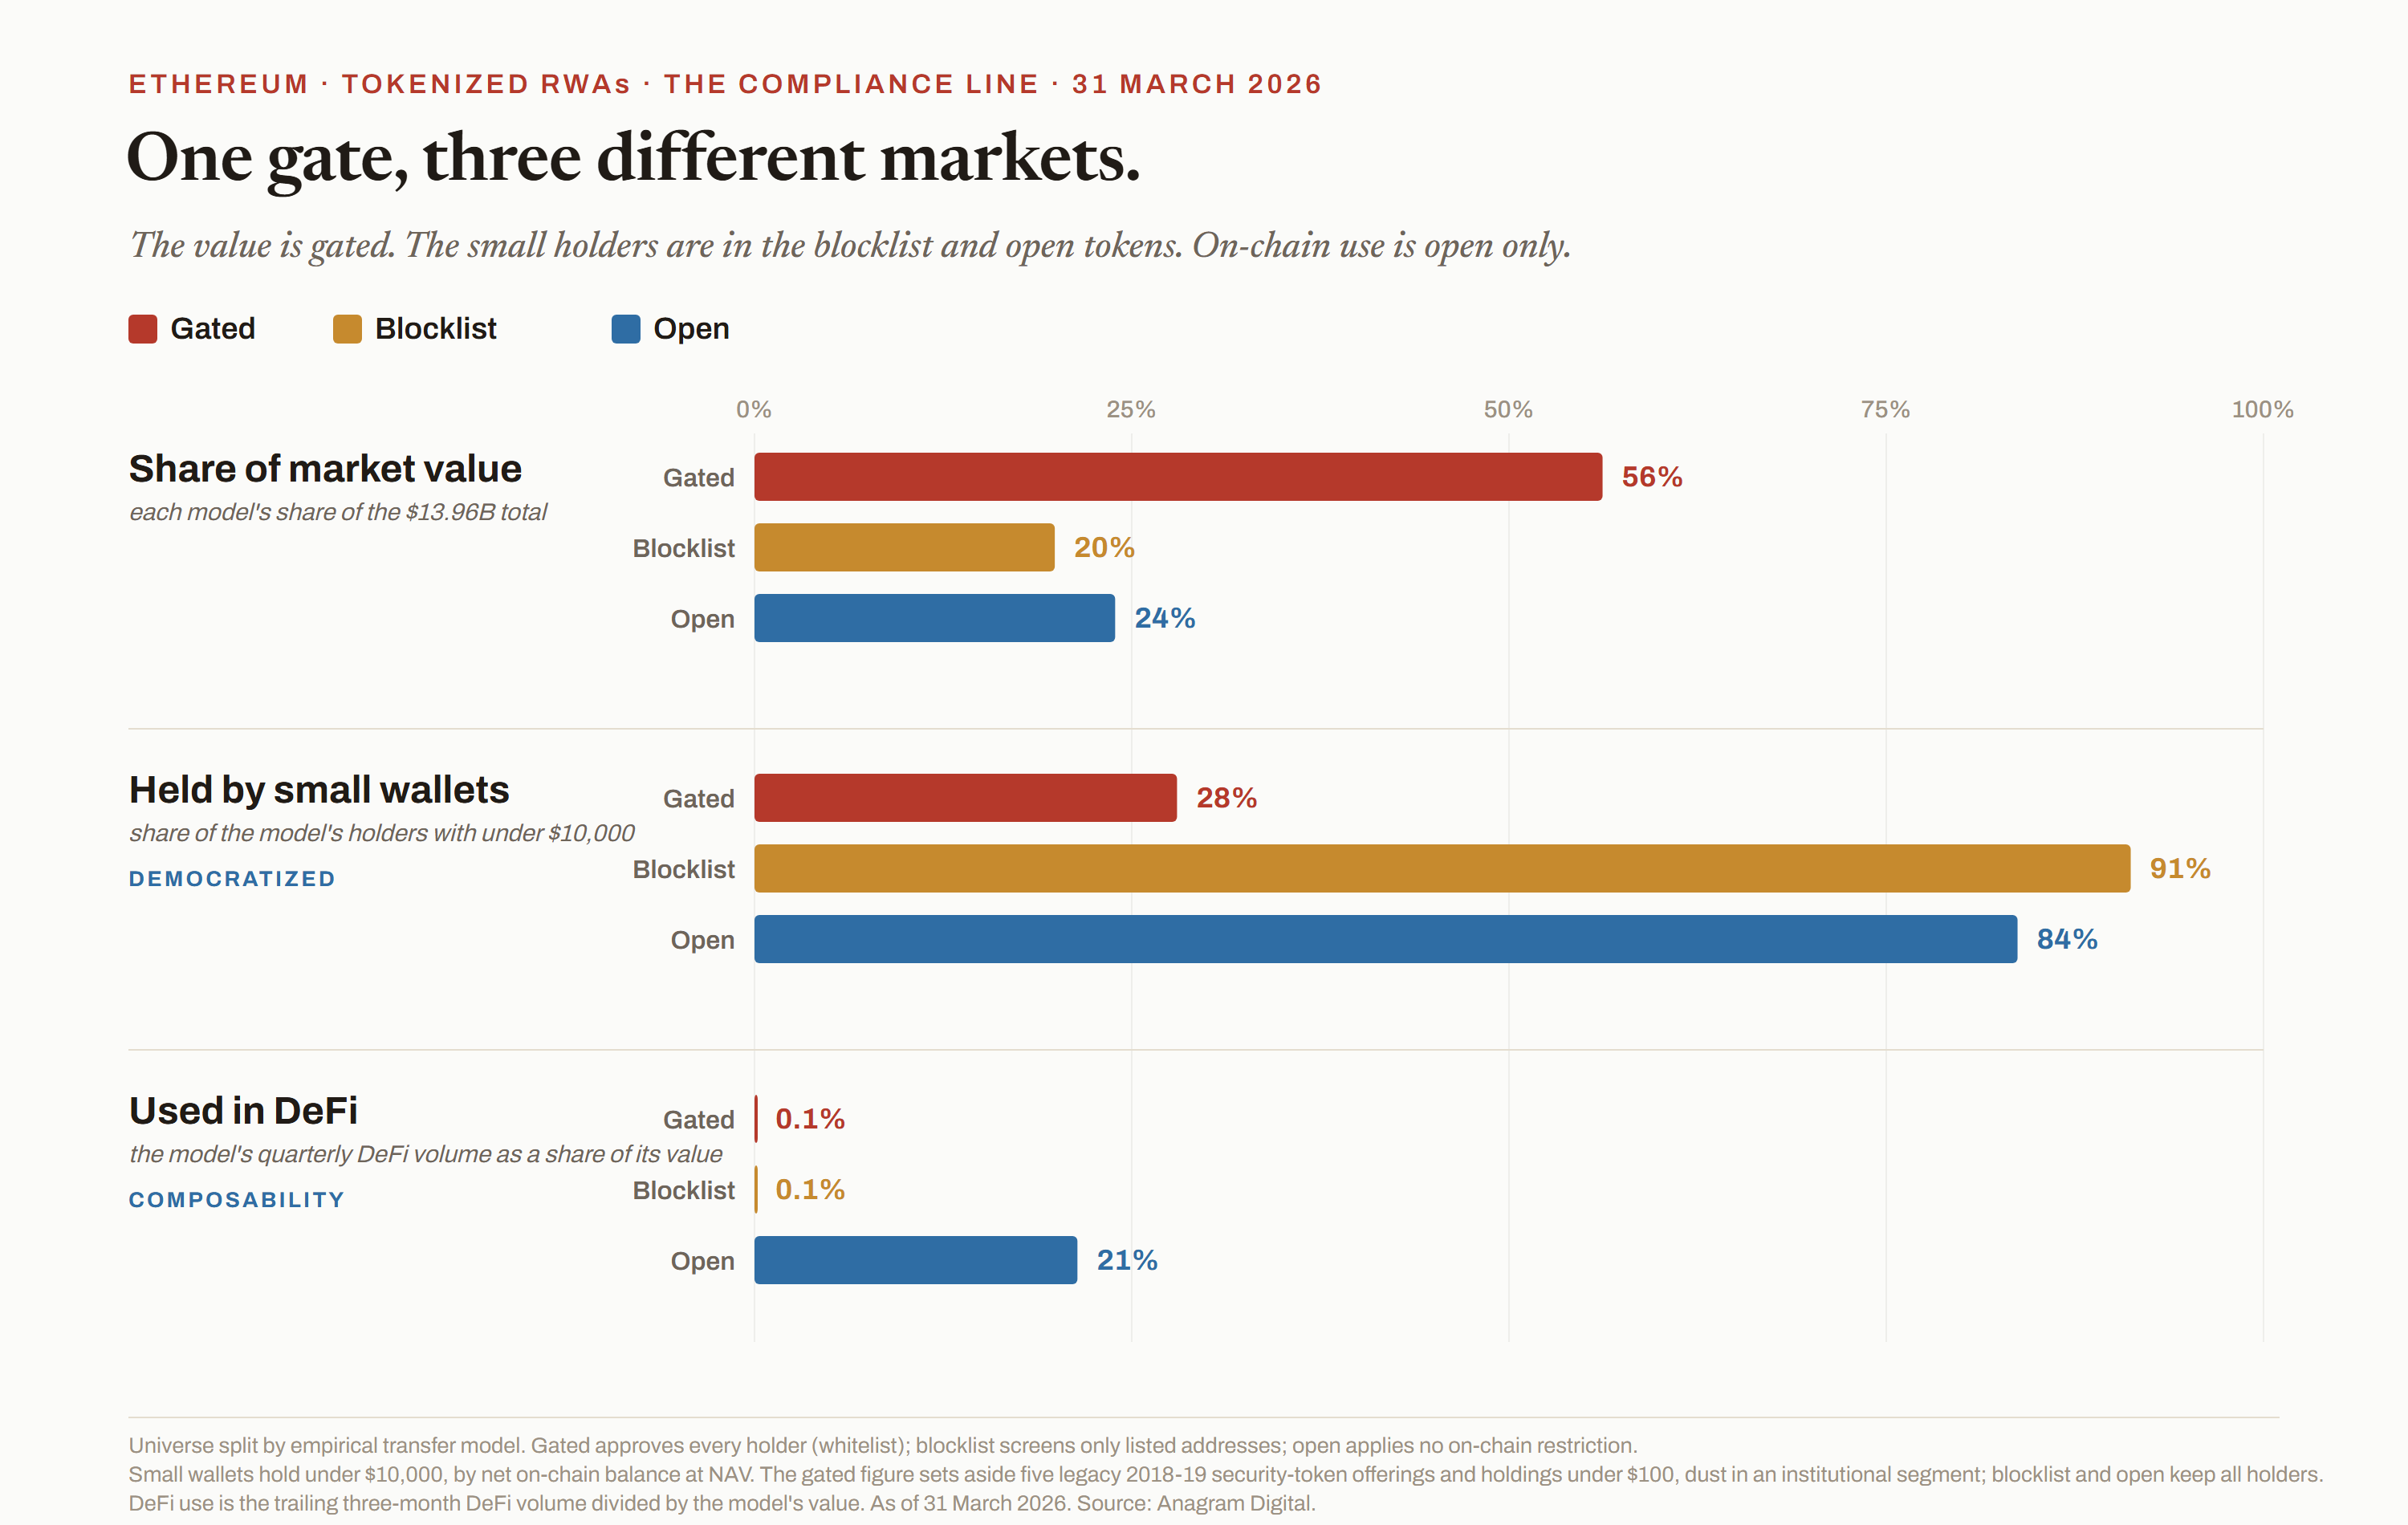
One variable keeps reappearing: the compliance model
Sorted by the transfer model from the previous finding, the earlier findings line up, though not into the two camps you might expect. The market sorts into three. Gated tokens, 56 percent of the value, are institutional money in relatively few hands. Blocklist tokens, 20 percent, are the most broadly held of the three. Open tokens, 24 percent, are broadly held as well, and they carry almost all of the on-chain use.
Broad ownership and real use fall on different lines
Adoption usually bundles two things, a wide base of holders and active use, and the three models pull them apart. By ownership, the line is the gate. Small wallets are about 91 percent of blocklist holders and 84 percent of open holders. Among gated holders they are only about 28 percent, once five legacy 2018-19 security-token offerings and sub-$100 dust are set aside, and the value sits with institutions.
By use, the line falls elsewhere. Open tokens turn over about 21 percent of their value through DeFi each quarter, gated and blocklist tokens a fraction of one percent. The blocklist tokens are the clearest case, the most small holders of any group and almost none of the use, tokenized stocks and dollar tokens that many people hold but few do anything with. Wide ownership reaches two of the three models. On-chain use reaches only the open one.
Where access actually lands
The open and blocklist tokens together carry on the order of eighteen thousand holders, around nine in ten of them under $10,000, ticket sizes far below what the traditional versions allow. The gated tokens hold most of the money among roughly two thousand holders. Tokenization's promise of open access is real, but it lands on the non-gated side.
United States securities law is part of why: it still restricts these assets to accredited or qualified investors, whatever form the token takes.14 Tokenization can shrink the ticket. It cannot lower the eligibility bar.
The gated segment lacks openness, not demand
It is young, it is where the regulatory ground is firmest, and it draws genuine demand from institutions, funds, treasuries, and the reserves that back other on-chain instruments. What a gate built for compliance forecloses is the open-market properties, a broad base of small holders and on-chain use.
The central challenge this market faces
The institutions the bull case counts on can enter only through the gated door, and that door opens onto the segment with the least on-chain use. The on-chain substance is in the open tokens, where serious regulated capital will not yet go.
Closing that distance, through compliance that can be enforced without forbidding participation, through enough regulatory clarity for institutions to hold freely transferable tokens, or through technology that lets the compliant and open sides interoperate, is the work this market has yet to do.
Tokens are split by their empirical transfer model from Finding 04: gated, blocklist, or open. Share of value is each model's share of the $13.96 billion total. Small wallets are holder addresses with a net on-chain balance under $10,000 valued at NAV. DeFi use is the trailing-three-month DeFi volume as a share of the model's value. Holder figures count on-chain addresses, so they include some contracts and intermediaries alongside end investors. For the gated small-wallet figure we set aside five legacy 2018-19 security-token offerings (chiefly SPiCE, Blockchain Capital, and Science Blockchain) and holdings under $100, operational dust rather than investors in an institutional segment. The blocklist and open figures keep all holders, since small holdings there are consistent with genuine retail. Figures as of 31 March 2026. Full sources and methodology in appendix. Source: Anagram Digital.
Section 06 · How the attributions are built
How we put a name to a wallet
Two holders, traced from wallet to name
Every finding in this report rests on attribution: turning an anonymous address into a named holder. Here we show the work twice, tracing the two clusters that matter most from wallet to name, so you can judge the method rather than take the conclusions on faith.
Two things have to be true before a balance means anything
You have to know the wallets move together, and you have to know who moves them. Clustering uses on-chain behavior, shared funding and shared signer keys, to group addresses controlled together, without yet saying by whom. Attribution then links that cluster to a named party, using independently known addresses and public disclosures. An attribution is only as good as the cluster beneath it. The two cases below run the method in opposite directions, one showing apparent demand to be wallets the issuer or its affiliates control, the other turning an apparent single whale into a pool of many owners. In both, the aim is the same: to get the number right.
Case one · Ondo and USDY
The concentration reported in the issuer-holdings finding is an observed fact. The identity of the holders is an inference we draw from the on-chain analysis, held with high confidence. This section shows how that attribution is made and lays out each finding so a reader can weigh it independently. The numbered findings are keyed to the badges on the figure.
How to read the on-chain analysis
Every wallet in the cluster at the center of this analysis, from the USDC hub and its spokes to the USDY holders, is a Gnosis Safe, a smart-contract wallet controlled by signer keys that are recorded on-chain, so two Safes that share a signer are demonstrably linked by a common keyholder. These particular Safes are also generated in bespoke vanity-address families, sharing a first and last hex pattern and a common signer set. Where a Safe shares signer keys with a wallet whose identity is independently established, the link is cryptographic rather than a matter of labeling. Each finding below is tagged as clustering, attribution, or both, ordered to show first that these wallets are one network, then that the network traces back to Ondo or entities affiliated with it.
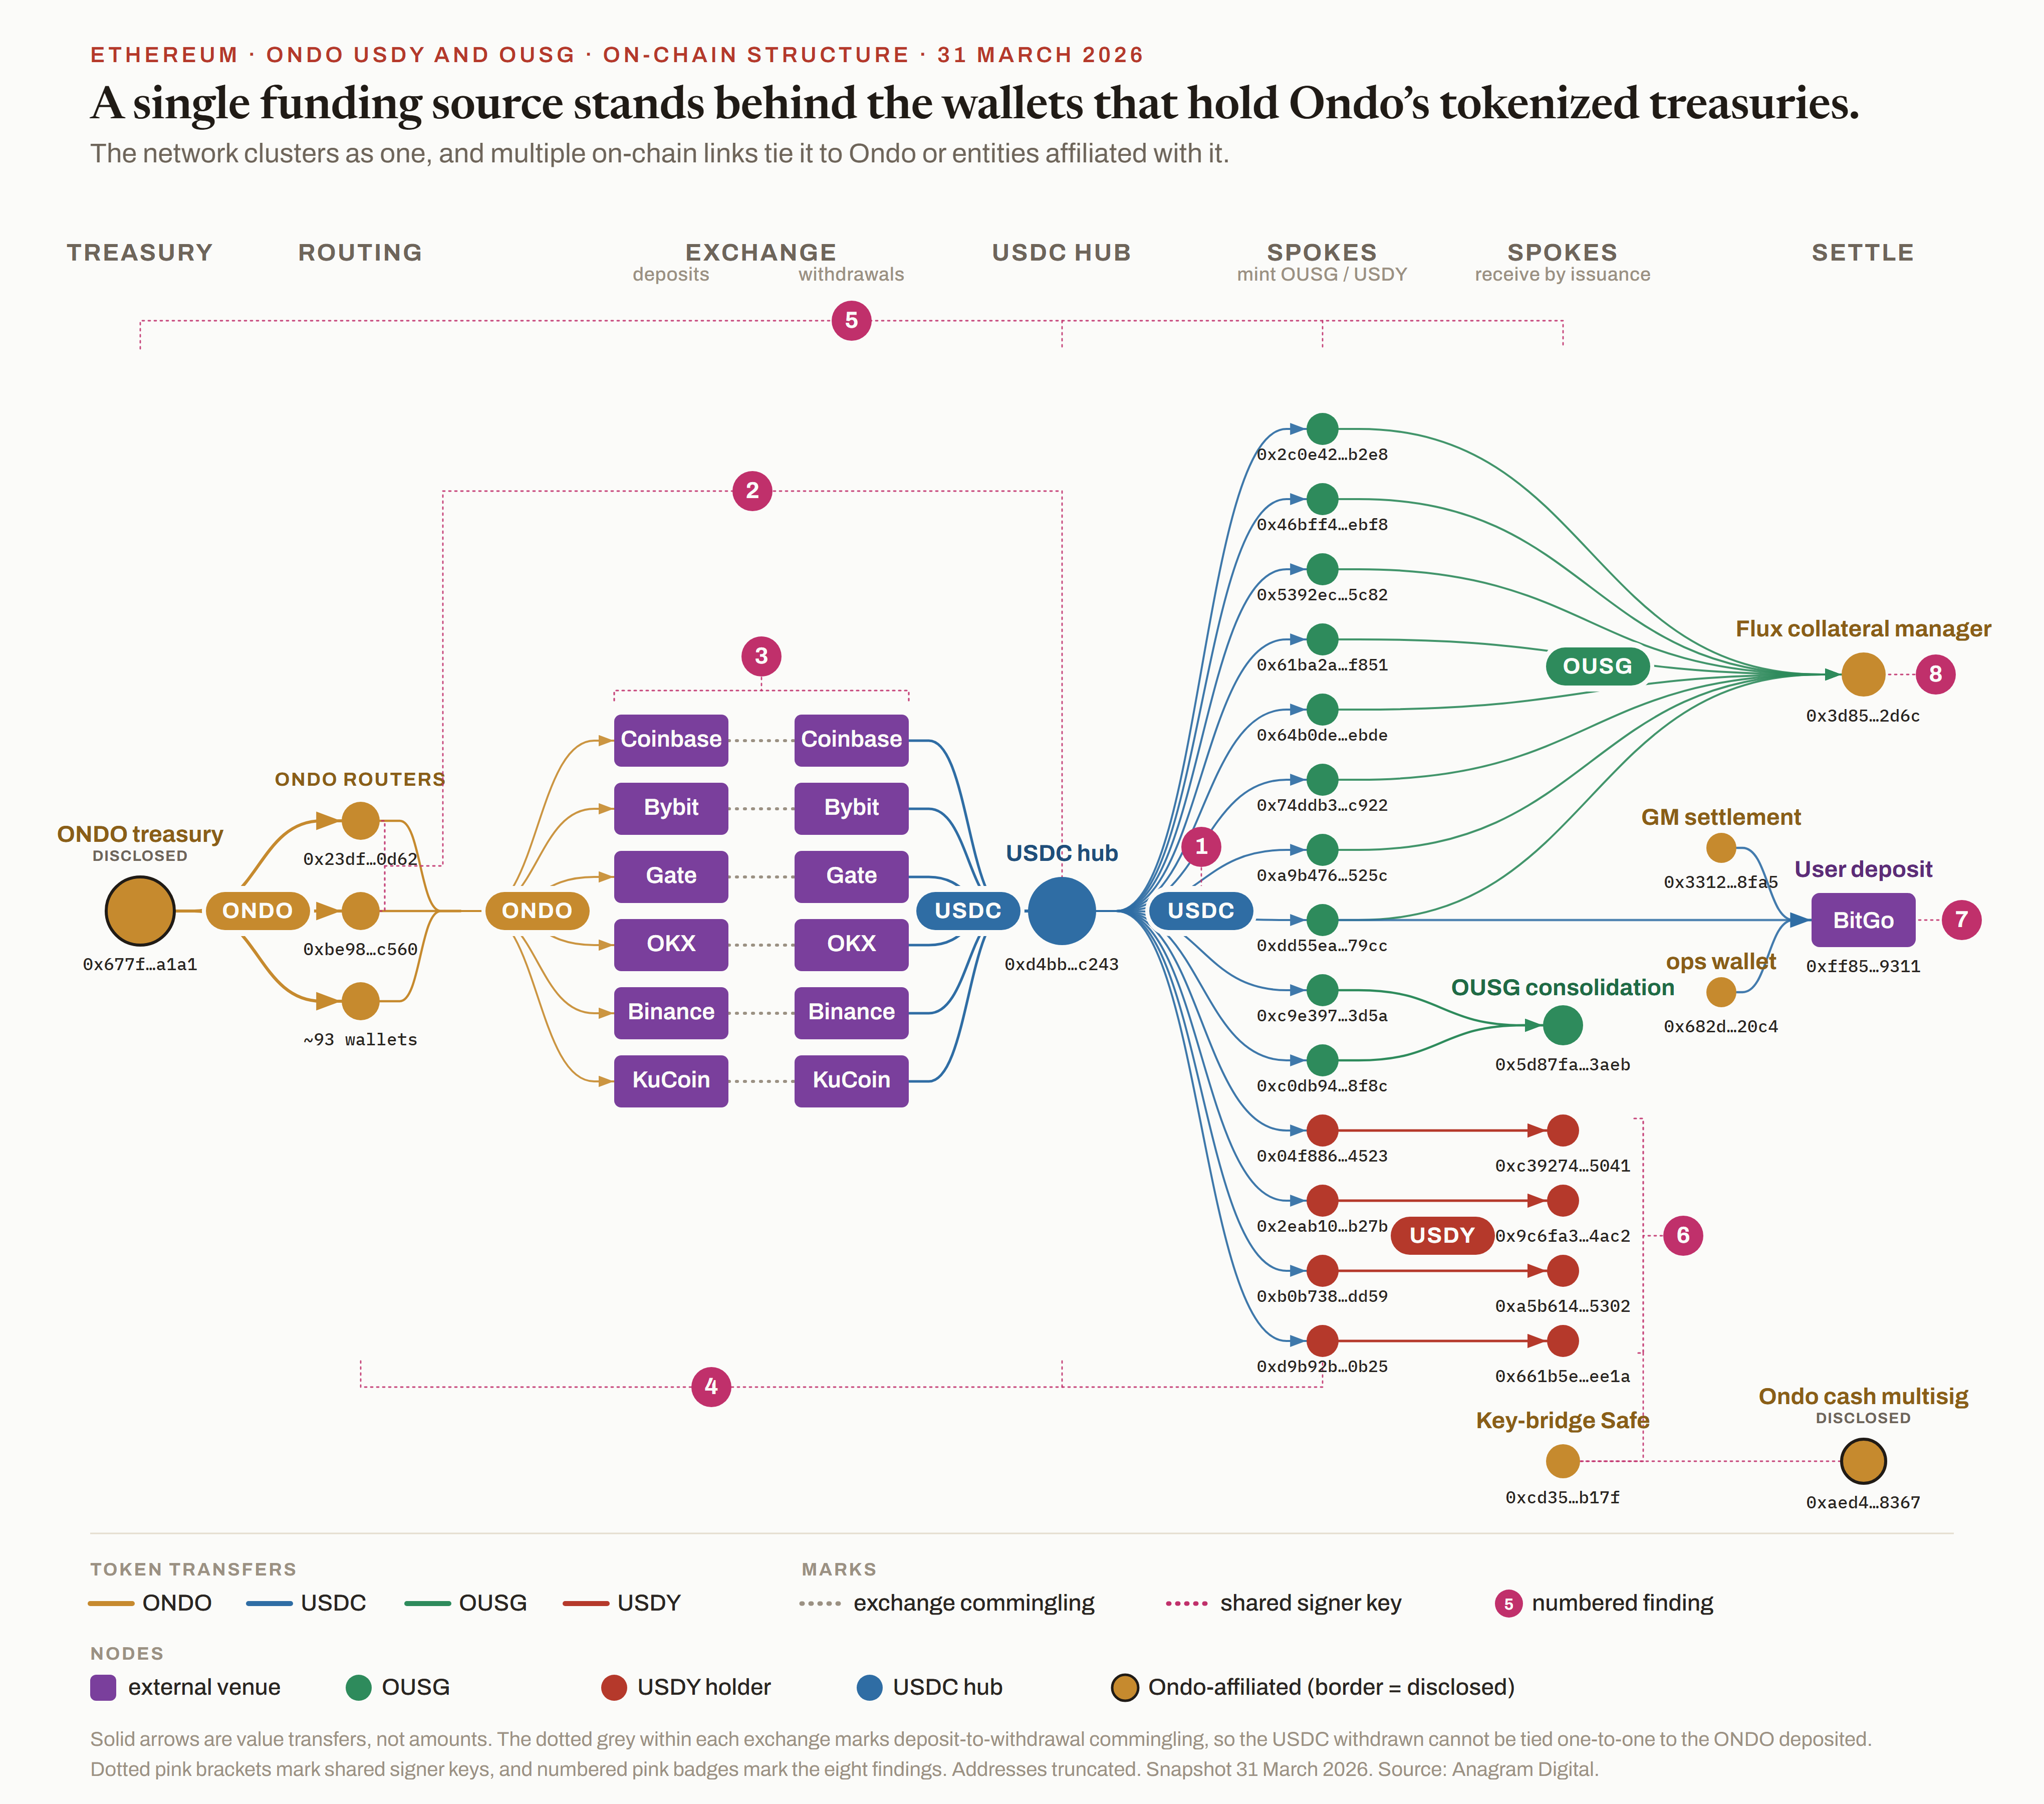
What the figure shows, read left to right
On the sell side, the ONDO treasury distributes its ONDO governance token through a fan of ONDO routers to six exchanges, more than 2 billion ONDO over the period.
On the buy side, a single USDC hub, roughly $709 million across the period, provisions a fleet of Safes (the spokes) that subscribe for USDY and OUSG. At the snapshot, eight wallets of this network held about $456 million of USDY between them, 85 percent of the circulating float: four hub-funded spokes and the four holder wallets they seeded, which receive their USDY by direct issuance. The fleet also held about $88 million of OUSG.
The findings
The numbers match the badges on the figure. Findings 1 to 4 point to these wallets being a single network. Findings 5 to 8 point to that network being Ondo or its affiliates. The eight wallets that held the USDY are listed in full in the appendix. Where a finding cites a smaller number, it applies to that subset of the fleet.
The USDC hub funds the entire fleet of spokes.
The USDC hub and the spokes draw their funding from one source, so they act as one network rather than as independent investors.
The USDC hub and two ONDO routers share signer keys (0xd7823461d72f121246197248d41a73f9633951cf, 0xdd0120f5d6c5d08d78f043f9f600c0e558133972).
Common control reaches the sell side: the ONDO routers and the USDC hub that funds the purchases are one cluster.
The USDC hub's dollars are withdrawn from the same exchanges the ONDO is deposited into.
A same-venue, directional link between the ONDO deposits and the USDC that funds the purchases. Because exchange balances commingle, this points toward one network rather than proving it.
The USDC hub, four of the USDY-holding spokes, and the ONDO routers were deployed by their own signer keys.
The fleet built its own Safes. An operator deploying its own wallets is a further sign of common control, not wholly independent actors.
The fleet, and other Ondo-affiliated wallets, are built with the same bespoke vanity-Safe scheme.
The shared construction binds the fleet into one cluster and ties that cluster to Ondo-affiliated wallets.
A signer key (0x6a95a204ad4a6842b2f0ae3bbb59f35e85594f46) that sits on the Key-bridge Safe (0xcd35671dcab88d05ee29dc4d360181529390b17f) was added as a signer to all four USDY holders on 10 April 2026 and removed from all four on 24 July 2026, in lockstep. At the snapshot the Key-bridge Safe carried all seven signers of the disclosed Ondo cash multisig (0xaed4caf2e535d964165b4392342f71bac77e8367), and it carries five of the seven today.
A signer key shared with the Key-bridge Safe, and through it with Ondo’s disclosed governance multisig, ties the cluster to wallets we attribute to Ondo. The lockstep addition and removal across all four holders is itself evidence of a single operator.
The fleet and other wallets we attribute to Ondo deposit to one user-specific BitGo account (0xff856a50d7c173c99fa7f0cd64b4345f82d59311).
The cluster deposits into the same user-specific custody account as wallets we attribute to Ondo, tying both to a single operator.
Two spokes route OUSG one-way into the Flux collateral manager (0x3d85c41e1a24a970a93436bf6379f53317272d6c), and two others consolidate theirs into a Safe of the same vanity construction (0x5d87fa995c54fff52cfe1c18d8ebf79f0eeb3aeb).
These spokes hand OUSG, with nothing returned in these transfers, to the Flux collateral manager disclosed in Flux’s own contracts repository and to a Safe within the same family. These one-way transfers are not market redemptions.
We are not alleging wrongdoing. There are ordinary reasons an issuer holds its own token at scale, from treasury management and unsold inventory to cross-backing its own products and seeding early liquidity, and Ondo publicly describes building cross-backed products.
The concentration is an observed fact. The identity of the holders is an inference we draw from the on-chain analysis, with high confidence, not a label any wallet carries. The further step, that Ondo bears the economic exposure or funded these positions by recycling proceeds from its own token sales, is not a claim we make. It has appeared in prior public commentary, which we neither adopt nor endorse, and our findings do not depend on it. Any such link would run through commingled exchange balances and cannot be proven dollar for dollar.
The denominator is all USDY outstanding on the token's main Ethereum contract at the snapshot, about $537 million. Supply still inside the issuance window sits in a separate token contract and is excluded from both the numerator and the denominator. USDY also circulates on other chains, which sit outside this analysis. The concentration described here is of the Ethereum supply, the token's largest venue.
Case two · the largest unattributed wallet
The largest address our attribution could not place at first pass, 0x3700bab28d29f5abc70ecf70a8efd96eed0f9a8f, holds about $706 million, most of it in the three ChinaAMC fund classes shown in the figure. That is the largest balance carried by any single address in this study (larger totals, like Sky’s, span several addresses). Counted as one investor it would be among the market’s largest positions. We assess it instead to be a pooled, or omnibus, custodial wallet: one on-chain address standing in for many underlying owners who hold through shared custody. It is one of at least two such wallets the same operator runs for these Libeara-tokenized ChinaAMC funds, and the largest component of the pooled-custody subtraction in the Finding 01 waterfall, so naming it correctly is what moves this $706 million from apparent concentration to genuine outside demand. It is the mirror of the Ondo case, the same method turning an apparent single holder into many pooled owners, to get the number right rather than to find fault. The determination rests on three independent lines that converge, numbered below the figure.
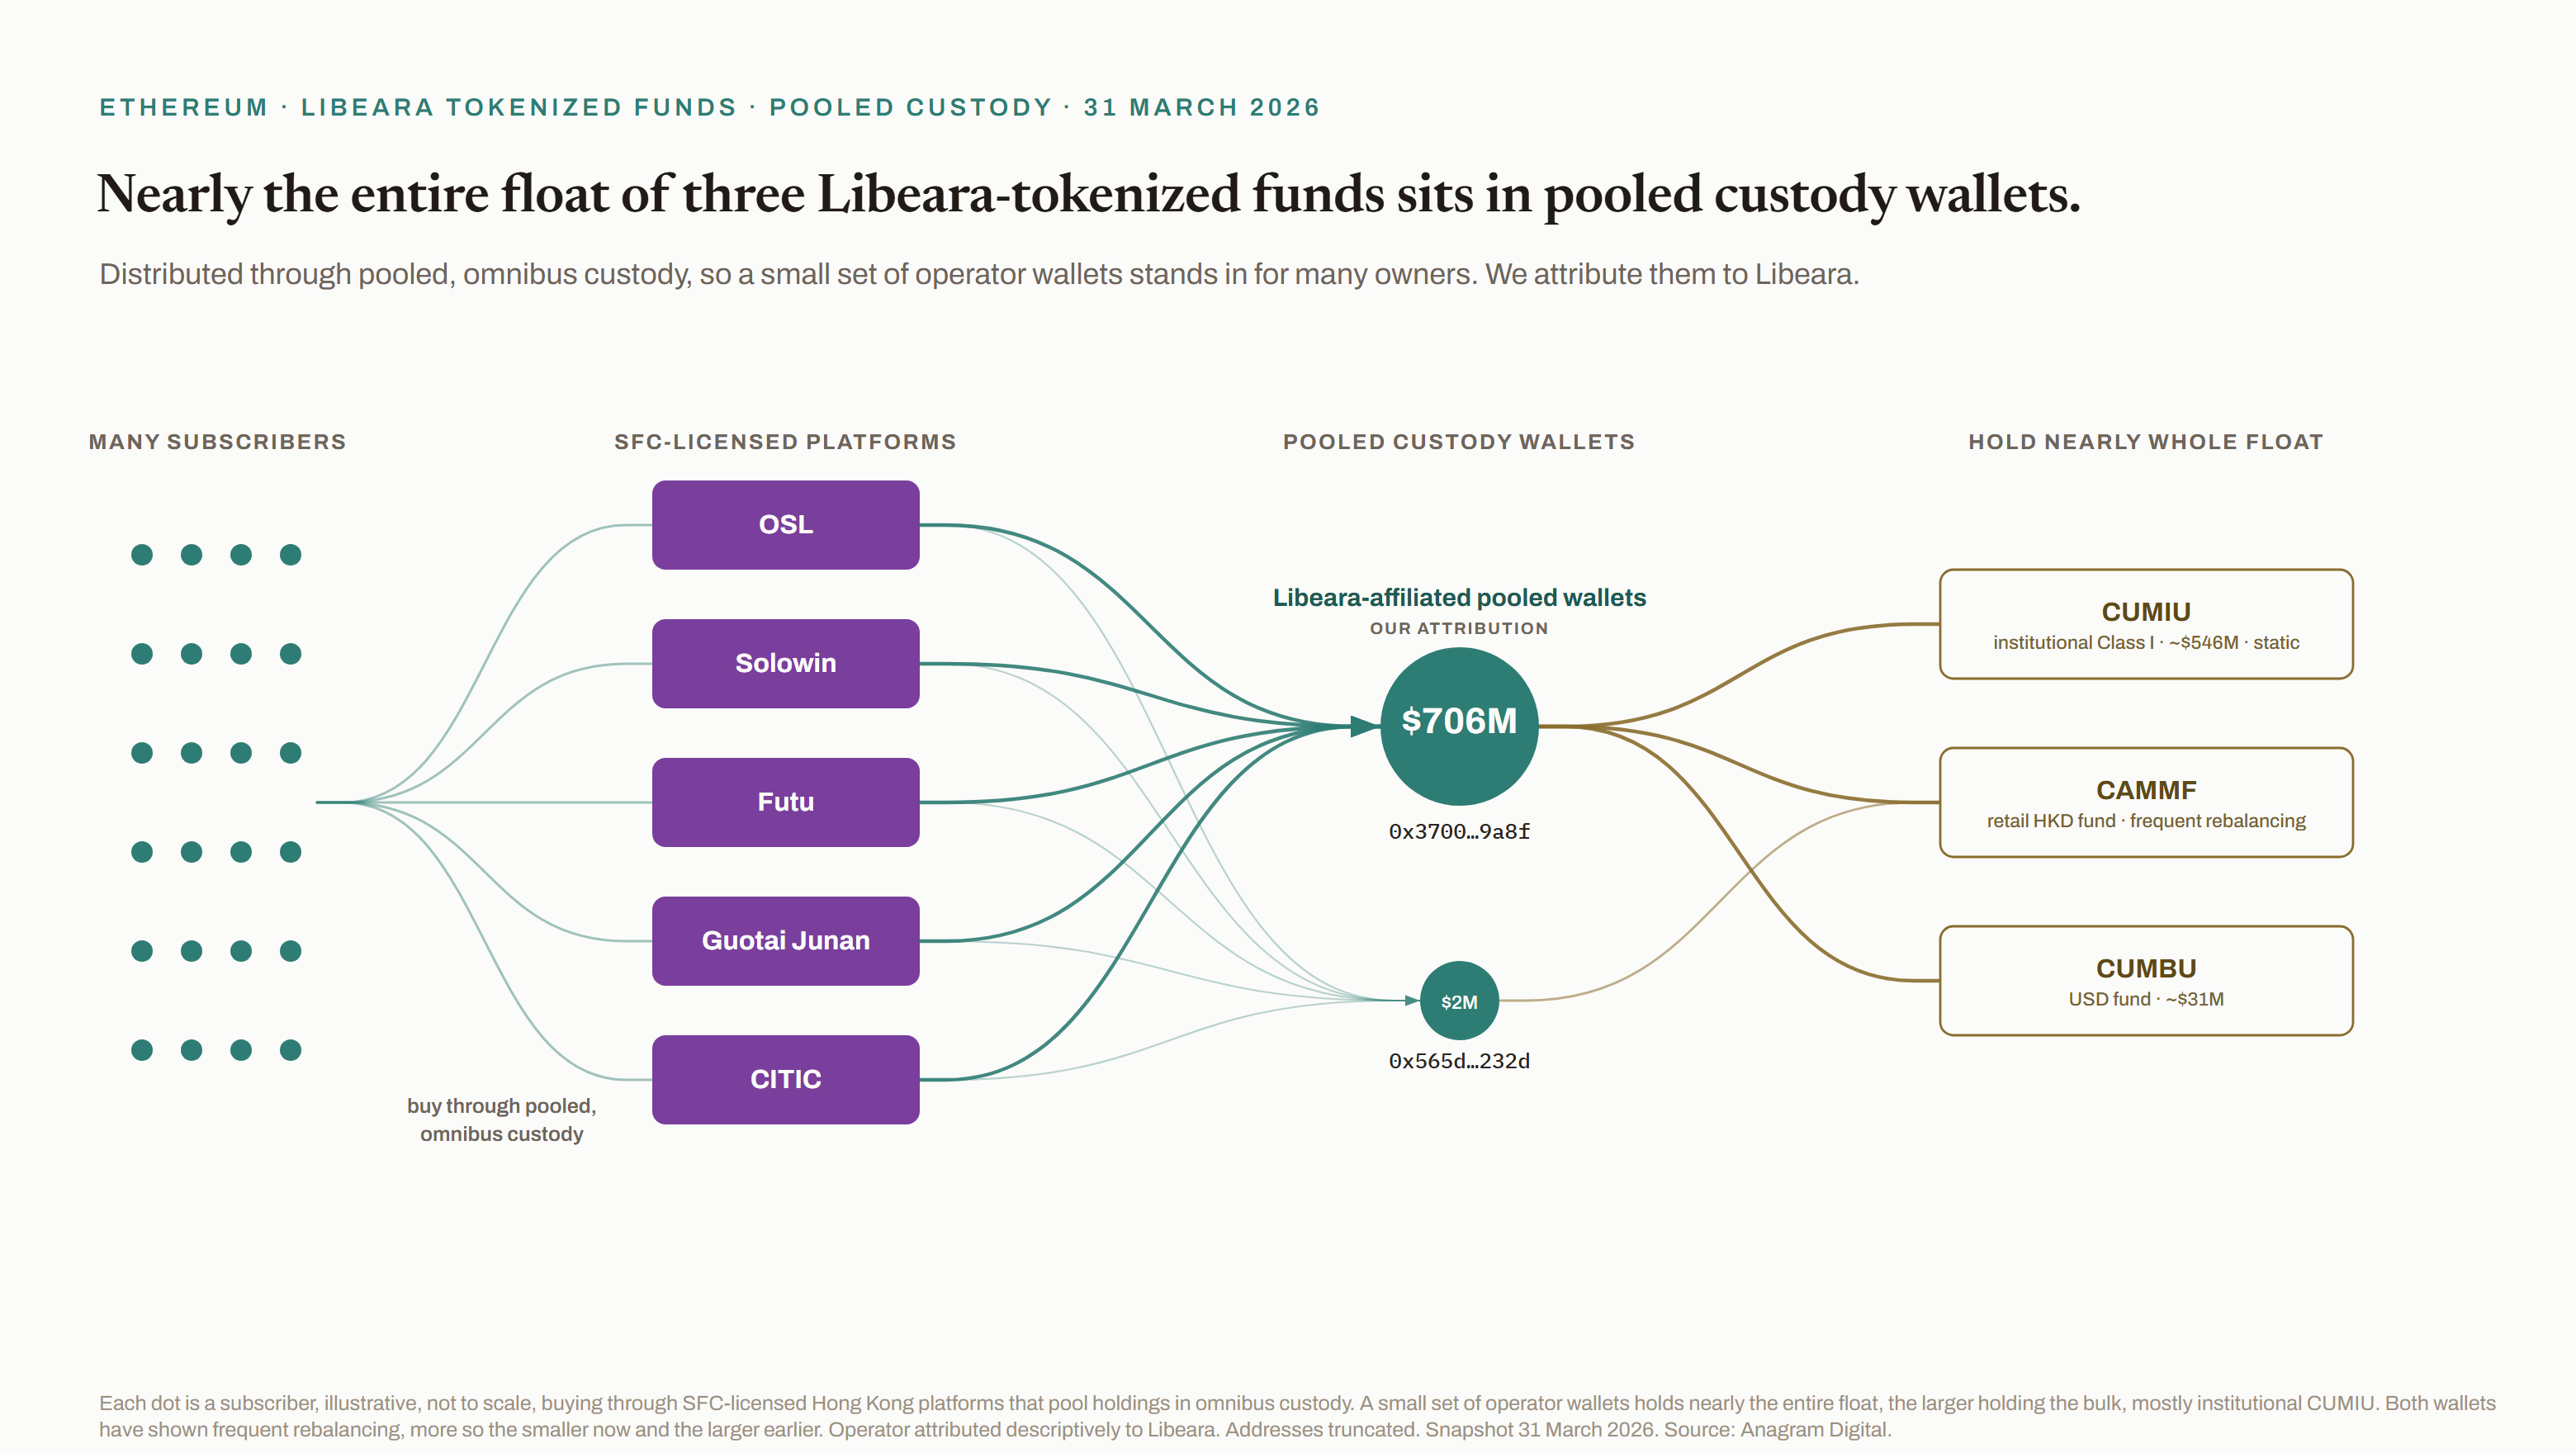
The findings
ChinaAMC’s tokenized money-market funds (CAMMF, CUMBU, CUMIU) are distributed through the SFC-licensed platforms labeled in the chart, which pool holdings in omnibus custody.[16][17]
Distribution like this requires pooled holding wallets on-chain.
Neither address has ever initiated a transaction of its own, yet both have shown frequent rebalancing as tokens are subscribed and redeemed, more so the smaller address (0x565d84f09e09d8608288f4402dca198c789a232d) today and the larger one earlier.
The activity of these addresses is consistent with that of pooled holding wallets, not a single fixed position.
Together the two wallets hold effectively the entire float of the fund classes, CAMMF 100 percent, CUMBU 100 percent, and CUMIU 99.4 percent.
If subscribers buy through shared custody, pooled wallets must exist on-chain, and these hold effectively the whole float. The custody for these funds sits here, not with independent investors.
We attribute the wallets descriptively to Libeara, the SC Ventures tokenization platform that is the on-chain agent for exactly these tokens, rather than to Standard Chartered, the parent bank and custodian of the funds’ underlying assets, because we have no on-chain proof of which brand operates the keys. We hold the pooled, omnibus structure with high confidence and the precise operator descriptively. We do not know, and do not claim, the number of underlying owners, and we do not describe the $706 million as retail: its largest slice, the institutional Class I fund CUMIU at about $546 million, reads as a small number of large allocations, while the retail subscriber signature is specific to the CAMMF class. On the opening map the wallet appears as the Libeara omnibus cell, and it is counted inside the 83 percent of value attributed to a named holder.
Full address lists for both clusters, together with the limitations of each attribution, are set out in the appendix.
Closing · Real in places, overstated in the aggregate
Real in places, overstated in the aggregate
The market, netted out
We set out to test whether there is real substance behind the growth of tokenized real world assets, or whether it is mostly story. Read across the findings, the answer is both, in identifiable proportions.
The growth is real, and so is some of what sits behind it
In particular places tokenization does something its traditional form cannot. The on-chain redemption rail works, and where it is used the exit is on demand.
Compliance is genuinely written into the tokens that carry most of the value, and it is enforced. The use of these assets as building blocks inside other on-chain systems is small but growing faster than the market itself. Where this report finds substance, it is concrete and it is checkable.
But the headline runs ahead of the breadth
A large share sits in wallets run by the issuers, their platforms, or entities closely affiliated with them rather than in independent buyers' own hands. Netting that out, the independently held market is about $10.7 billion and the part held directly on-chain by independent owners is about $8.6 billion, well below the $14 billion total.
Most of the value that remains is gated to approved institutions. Most tokenized assets are still bought and held exactly as their off-chain versions would be. And the programmability most clearly in use restricts access rather than widening it. Neither the dismissal that it is all hype nor the verdict that the revolution has arrived survives contact with the holder-level data. The market is real where it is real, and overstated where it is summed up.
What would move the verdict
None of this is visible from a headline number. A total cannot tell an outside buyer from an issuer holding its own product, or a working market from a dormant one, which is why this report works at the level of who holds what and what they do with it.
The signals worth watching are the ones that would widen the substance: whether the open segment's base of small holders keeps growing, whether composability's steep trajectory continues, whether redemption liquidity holds up under stress, and whether compliance and open participation stop being mutually exclusive. If those trends hold, the substance catches up to the story. For now, the distance between the two is the finding.
Looking ahead
What we did not cover
The questions this report leaves open, and where we go next.
Financial stability is the largest question we have not priced
Several threads in the data point the same way: collateral looped through lending to multiply exposure, gated tokens reaching open DeFi through freely transferable wrappers, reserves of one on-chain instrument backing another, a few assets turning over more than their entire base each month, and a handful of very large holders who could leave at any moment. In a tightly connected on-chain system, these are the ingredients of systemic fragility. Mapping that connectedness is the next study we intend to publish.
The rest of the distributed market sits outside this report's frame
The same kind of assets live on roughly thirty other public chains: billions of dollars more in holdings, issuers we have not counted, and market dynamics that may look nothing like Ethereum's. All of it is measurable with the same approach, and mapping it is the natural next expansion of this work.
And the holder-level view opens more than we chased
USDY is the only issuer-linked case we presented in full. The market-level netting in Finding 01 already counts other tokens whose supply sits partly in wallets linked to their issuers, and some of that will have entirely ordinary reasons. We worked one case at full evidentiary depth, and separating the ordinary from the notable, issuer by issuer, is work the same method can do.
So is drawing the line between genuine redemption and mere bridging or conversion, and naming the market-makers behind on-chain liquidity. To follow the next installment, leave your email at anagram.digital.
Contributors
Who produced this report
Max Galka
Max Galka researched and wrote this report. He is the founder of Anagram Digital, where he leads custom blockchain research and analytics. He was previously the founder and chief executive of Elementus, a blockchain analytics company. He is a named inventor on two patents in blockchain analysis. His on-chain research has been cited in the Wall Street Journal and Bloomberg.
Alex Mologoko
Alex Mologoko contributed to the research. He leads blockchain research and development for institutional clients, government agencies, and bankruptcy administrators. He was previously head of digital-assets and markets research at CipherTrace, a blockchain analytics firm, and spent eight years at J.P. Morgan as an executive director in electronic and algorithmic trading.
About Anagram Digital
Anagram Digital is a blockchain intelligence and research firm. It resolves the on-chain questions that off-the-shelf tools cannot: attributing addresses to the real world entities behind them, reconstructing the transactions that connect them, and answering the harder ones that follow for financial institutions, funds, and investigators. Every engagement is bespoke and built to withstand scrutiny from regulators, courts, and counterparties. The work spans custom research, due diligence, transaction and flow tracing, and litigation and investigation support. This report is a piece of that primary research, built from on-chain data rather than republished issuer totals.
Work with us
Anagram takes on bespoke engagements for counsel, financial institutions, and funds: litigation support and expert witness work, flow-of-funds tracing, custom research, and issuer and token due diligence of the kind shown throughout this report. To scope a project, get in touch at max@anagram.digital.
Appendix
Methods, sources, and limitations
How the figures in this report were produced, and where to doubt them.
1. Scope and definitions
This report covers tokenized real world assets of the securities type on Ethereum: tokenized treasuries, private credit, funds, equities, and similar instruments. In the distributed market the token itself is the transferable instrument, held in the owner's own wallet. In the represented market the token is only a record on a permissioned ledger while the asset stays in the conventional system. Only the distributed market can be studied on-chain at the holder level, so it is the only market we measure.
We exclude what is not a tokenized security: stablecoins, including those backed by real world assets, passive crypto trusts and exchange-traded products, and tokenized commodities such as gold and silver. The universe is fixed at 418 token contracts as of the snapshot date, 31 March 2026 (a few products deploy the same token across more than one contract and are counted per contract), assembled into a master token list that records each token's platform, asset class, asset profile, supply, and transfer behavior.
Throughout the findings we group tokens by asset profile, a simpler division than asset class. Private markets covers private credit, funds, real estate, venture, and other higher-yield holdings. Money markets covers treasuries and short-term sovereign instruments. Public equity covers tokenized stocks and exchange-traded funds.
2. Data and reproducibility
Two layers sit behind every figure. Balances are observed, read directly from on-chain state at the snapshot block rather than estimated or self-reported. Token balances were read through the Etherscan API, and any reader can reproduce them from the same public state. The USDY token contract at 0x96f6ef951840721adbf46ac996b59e0235cb985c, for example, shows its concentrated holder structure on any block explorer.
Dollar values use each token's net asset value in force on the snapshot date, read by RPC call to the token's price oracle where a usable one exists, otherwise from the issuer's own published NAV and other public sources.
The second layer, the identities behind the balances, is inferred rather than observed, and is described next.
3. Attribution methods and our technology
Matching addresses to the entities behind them is what turns a public ledger into a readable market. Using Anagram Digital's entity-resolution technology and expert judgment, we attribute addresses to issuers, protocols, exchanges, dealers, and a wide range of other on-chain services. Of the value studied here, 83 percent is attributed to a named holder.
Attribution is a judgment, not a direct reading, and we treat it as such. It draws on known-address sets, the behavior and transaction graph of each address, and corroboration across independent signals, and each attribution carries a level of confidence. Where a single attribution carries a finding, as with the Ondo holdings, we set out the specific on-chain evidence and state how confident we are.
4. Holdings, issuer-affiliated classification, and the supply-to-adoption waterfall
Headline supply is not the same as independent demand, so we separate the two. We write issuer for the party operating a token's on-chain program, the asset manager itself or the tokenization platform acting as its agent. Issuer-affiliated wallets are the issuer or its affiliate's own, covering treasury, operational and deployer addresses, unsold inventory, cross-backing between an issuer's own products, and redemption float. They are reported apart from outside holders. Omnibus custody, where one address pools many underlying owners, is treated as genuine demand but flagged, because it hides the number of beneficial holders behind a single cell. Pending-issuance supply, such as USDY still inside its restricted period and shown separately as cUSDY, is counted in gross supply but set aside from free-float findings like the USDY concentration figure.
Netting these out gives the waterfall the findings rely on. A headline of $13.96 billion, less issuer-held supply of about $3.27 billion, leaves roughly $10.69 billion independently held. Removing about $2.08 billion pooled in off-chain custody leaves roughly $8.61 billion held directly on-chain by independent owners. Concentration measures are computed on this netted base, with each pooled account counted as a single holder. The issuer-affiliated figures aggregate attributions across the full issuer and platform universe. This report publishes one issuer-level case in full, the Ondo attribution in Section 6, as the worked example of the evidentiary standard applied to the rest.
5. Transaction restrictions (gated, blocklist, open)
Each token's transfer behavior was tested empirically rather than read from its code. Using Tenderly, we simulated multiple transfers for every token, sending to and from arbitrary addresses and recording which transfers reverted. Empirical testing is more reliable than reading a contract, because what a token does can depend on configuration and state that source code alone does not reveal.
The result sorts each token into one of three models. Gated tokens block any transfer whose recipient is not on an approved list. Blocklist tokens allow transfers to ordinary wallets and block only specific addresses the issuer has listed. Open tokens carry no on-chain restriction at all. Most gated tokens follow the permissioned-token standard ERC-3643.
The open classification was confirmed against real addresses on the OFAC Specially Designated Nationals list rather than synthetic ones. Among the recipients used was 0xa7e5d5a720f06526557c513402f2e6b5fa20b008, an address designated in connection with terrorism financing. For the open tokens these transfers completed in simulation. For blocklist tokens they reverted. Gated tokens rejected any recipient that was not pre-approved.
6. DeFi volume and composability
Composability is an activity, so we measure it as a flow, the value of RWA tokens moving into DeFi, rather than as a balance sitting inside it. A single DeFi interaction usually involves a chain of transfers hopping between several protocols, so simply adding up every transfer into a DeFi address would count the same activity many times over. To avoid that, we count only the first hop, the transfer that moves a token from a non-DeFi wallet into a DeFi protocol.
Transfers between DeFi protocols are not counted, and neither are transfers carrying tokens back out to a non-DeFi wallet, because counting both the way in and the way out would book one interaction twice. For this purpose a non-DeFi wallet is any address not assigned to a DeFi protocol, namely ordinary wallets and multisig wallets. All other smart contracts are treated as DeFi venues. The venue side of this classification is an attribution product of its own. The map behind it resolves 130 named DeFi protocols across 859 contract addresses, built with the same entity-resolution technology as the holder attributions. The default can overcount where an unidentified contract is custodial rather than financial, and we flag that residual rather than assume it away.
Two further exclusions follow the same logic. Assets held as passive backing are not composability and are left out. Transfers between wallets belonging to one entity, along with bridging, are removed as internal movement rather than economic use. A naive count of all on-chain transfers would run several times larger than the figures we report.
The relative measure used in the scatter is a turnover ratio, a token's trailing-three-month DeFi volume divided by its asset base, which shows how intensively each token is used rather than its raw size. Collateral held at centralized venues is reported separately, as a standing balance rather than a flow.
7. Redemptions
On-chain a redemption appears as a burn, a transfer to the zero address, but not every burn is a redemption. Burns also include cross-chain bridge-outs, where a token is destroyed on Ethereum and reissued on another chain, and token conversions, where one version of an asset is swapped for a sibling in the same transaction.
To separate them we inspect each burn transaction. Bridge-outs are identified from a fixed set of cross-chain bridge events in the transaction logs, the events emitted by bridges such as Wormhole, Chainlink CCIP, and LayerZero. Conversions are identified by a sibling token minted in the same transaction. The remaining burns, those with no bridge event and no offsetting mint, are treated as redemptions.
One case resists this test. Where an issuer runs its own custodial burn-and-mint bridge, the Ethereum side of a bridge-out is a bare burn that looks identical to an off-chain redemption, and the two cannot be told apart from Ethereum data alone. We flag this residual rather than assume it away.
8. The Ondo USDY attribution
The full walkthrough of this attribution, with the figure and the numbered findings, is in Section 6. What follows here is the reference material: the complete list of addresses and the limitations of the analysis.
Scope and regulatory context
What we report is the on-chain structure we observe and the inferences we draw from it, under the limits set out above. Questions of motive or intent lie outside what on-chain data can establish, and we do not address them. A separate U.S. Securities and Exchange Commission review of Ondo, opened in 2023 and closed in late 2025 with no enforcement action, concerned the securities-law treatment of Ondo’s tokenized Treasury products and of the ONDO token, as publicly reported. So far as the public record shows, it did not address the on-chain holder concentration described here, and we draw no connection between the two.
Address reference
Full addresses for every labeled node.
Limitations of this analysis
Ondo does not publicly disclose the operator wallets behind its products, so the apparatus is knowable only by on-chain forensics, and the identity attributions are inferences from on-chain artifacts rather than disclosed facts. The BitGo deposit address is a user-specific forwarding address tied to a single BitGo account. Wallets we independently attribute to Ondo deposit into it, which supports the inference that the account is Ondo’s and that the other wallets depositing there belong to the same account holder. The bespoke vanity-Safe construction is likewise specific to this cluster, not a generic custody-vendor artifact. The sell-side path is collapsed for legibility, and the raw network spans about 189 addresses across the distribution fan and exchange deposits. Any proceeds-recycling interpretation cannot be proven through commingled exchange balances, and we do not assert it. We regard the common-control finding as very strong, hold the Ondo-affiliated-identity attribution with high confidence, and keep the economic-ownership question open. The headline figures behind the finding, the roughly 85 percent share of about $537 million in USDY supply (475.6 million tokens outstanding on Ethereum at the March 31 NAV of $1.13, of which the eight wallets held 403.2 million tokens), are set out in the finding itself and verifiable from the 0x96f6ef951840721adbf46ac996b59e0235cb985c token's holder list as of 31 March 2026. Bridge-locked and restricted-period supply sits in a separate token contract and is excluded from both numerator and denominator.
9. Reliance and limitations
What this report rests on is public Ethereum state, which anyone can read and reproduce, named price and NAV sources, and Anagram Digital's own attribution layer over the raw data.
The limitations follow from that. Attribution is an inference, not a fact written on the chain, and about 17 percent of the value studied is unattributed. Dollar totals depend on NAV, which is oracle-fed or issuer-published, so they value holdings at stated marks rather than at what a secondary market would pay, a distinction Finding 03 shows can be large for illiquid tokens. Pooled and omnibus accounts hide the number of beneficial owners behind them. Some attributions are provisional, and the line between an issuer and an affiliated entity is a matter of judgment. The view is a single point in time, the snapshot date, and it covers Ethereum only, so assets and activity on other chains sit outside the frame. The securities status of some tokens is genuinely contested rather than settled, which is why the compliance finding is put conditionally. Simulated transfers can have edge cases that a single test would miss, which is why several were run for each token. Where any of these could change a conclusion, we say so in the finding itself. This is independent research. Neither the author, the contributors, nor Anagram Digital holds a position in any in-scope token or in ONDO, nor any direct position in any company named in this report. No named party commissioned or paid for it, and nothing in it is investment advice.
10. Glossary
Distributed versus represented
A distributed token is the transferable instrument itself, held in the owner's wallet. A represented token is a record on a permissioned ledger while the asset stays in the conventional system. This report measures the distributed market.
Gated, blocklist, open
The three transfer models. Gated allows only approved holders, blocklist blocks only listed addresses, open applies no on-chain restriction.
Issuer-affiliated versus omnibus
Issuer-affiliated wallets are the issuer or issuer affiliate's own holdings. Issuer covers the token program's operator, whether the asset manager or its tokenization platform. An omnibus wallet is one address that pools many underlying owners.
Composability
The use of a token as a building block inside other on-chain systems, such as collateral, lending, or automated strategies.
Turnover ratio
A token's DeFi volume over a period divided by its asset base, a measure of how intensively it is used.
NAV. Net asset value, the per-token value of the underlying asset, used to convert token balances to dollars.
Observed versus inferred
Balances are observed directly on-chain. Identities are inferred through attribution.
Asset profile
The grouping used across the findings: private markets, money markets, and public equity.
Appendix · Token-level data
Every in-scope token
All 418 in-scope token contracts, the complete universe behind the $13.96 billion headline, ranked by value on Ethereum. This is the full version of the top-token table shown earlier.
| Token | Platform | Value | Model |
|---|---|---|---|
| syrupUSDC | Maple | $1.82b | O |
| JTRSY | Centrifuge | $1.17b | G |
| syrupUSDT | Maple | $1.00b | O |
| BUIDL | Securitize | $843m | G |
| WTGXX | WisdomTree | $815m | G |
| BCAP | Securitize | $757m | G |
| USTB | Superstate | $624m | G |
| cUSDY | Ondo | $558m | G |
| CUMIU | Libeara | $549m | G |
| USDY | Ondo | $537m | B |
| TBLLx | xStocks | $504m | B |
| OUSG | Ondo | $319m | G |
| CFSRS | Asseto | $205m | G |
| BUIDL | Securitize | $169m | G |
| FDIT | Fidelity Investments | $167m | G |
| USCC | Superstate | $150m | G |
| STBT | Matrixdock | $150m | G |
| JAAA | Centrifuge | $139m | G |
| USYC | Circle | $133m | G |
| thBILL | Theo | $132m | O |
| AA_FalconXUSDC | Pareto | $130m | O |
| STAC | Securitize | $105m | G |
| BELIF | Libeara | $102m | G |
| CAMMF | Libeara | $92m | G |
| TBILL | OpenEden Digital | $75m | G |
| AICRT | Libeara | $70m | G |
| mF-ONE | Midas | $69m | O |
| ULTRA | Libeara | $68m | G |
| USTBL | Spiko | $59m | G |
| TONXx | xStocks | $57m | B |
| BENJI | Franklin Templeton Benji Investments | $47m | G |
| CUMFU | Libeara | $47m | G |
| mTBILL | Midas | $46m | O |
| SAFO | Spiko | $45m | G |
| ACRED | Securitize | $41m | G |
| CRCLx | xStocks | $40m | B |
| RLP | Resolv | $39m | O |
| CASHx | KAIO | $37m | G |
| CRCLon | Ondo | $36m | B |
| VBILL | Securitize | $32m | G |
| SPYon | Ondo | $32m | B |
| CRMBR | Libeara | $31m | G |
| CUMBU | Libeara | $31m | G |
| SPICE | Securitize | $27m | G |
| AICHT | Libeara | $26m | G |
| VOLTx | KAIO | $26m | G |
| IVVon | Ondo | $22m | B |
| GOOGLx | xStocks | $22m | B |
| COSX | Securitize | $22m | G |
| QQQon | Ondo | $21m | B |
| NVDAx | xStocks | $21m | B |
| QQQx | xStocks | $21m | B |
| AMZNx | xStocks | $21m | B |
| SPYx | xStocks | $20m | B |
| AA_RockawayXUSDC | Pareto | $20m | O |
| PRPTY | DigiShare | $20m | G |
| METAx | xStocks | $20m | B |
| AAPLx | xStocks | $19m | B |
| PLx | xStocks | $18m | B |
| MACROx | KAIO | $18m | G |
| MUx | xStocks | $18m | B |
| WULFx | xStocks | $18m | B |
| INTCx | xStocks | $17m | B |
| TLTon | Ondo | $17m | B |
| MSTRx | xStocks | $17m | B |
| sAID | GAIB | $16m | O |
| reUSDe | Re | $16m | O |
| IEFAon | Ondo | $16m | B |
| TSLAx | xStocks | $16m | B |
| SCOPEx | KAIO | $15m | G |
| MRVLx | xStocks | $15m | B |
| HUTx | xStocks | $15m | B |
| COINx | xStocks | $15m | B |
| AGGon | Ondo | $14m | B |
| PLTRx | xStocks | $14m | B |
| ASMLx | xStocks | $13m | B |
| CORZx | xStocks | $13m | B |
| XOMx | xStocks | $13m | B |
| TSMx | xStocks | $13m | B |
| bERNX | Backed Finance | $13m | B |
| CVXx | xStocks | $13m | B |
| RIOTx | xStocks | $12m | B |
| NVDAon | Ondo | $12m | B |
| LINx | xStocks | $12m | B |
| HONx | xStocks | $12m | B |
| SCI2 | Securitize | $12m | G |
| HOODx | xStocks | $12m | B |
| JNJx | xStocks | $12m | B |
| AA_idle_Fasanara | Pareto | $12m | O |
| MARAx | xStocks | $12m | B |
| MRKx | xStocks | $11m | B |
| WMTx | xStocks | $11m | B |
| AMDx | xStocks | $11m | B |
| GLXYx | xStocks | $11m | B |
| TIPon | Ondo | $11m | B |
| KOx | xStocks | $11m | B |
| ITOTon | Ondo | $11m | B |
| AMBRx | xStocks | $11m | B |
| GMEx | xStocks | $11m | B |
| PEPx | xStocks | $11m | B |
| IEMGx | xStocks | $11m | B |
| PFEx | xStocks | $11m | B |
| SCHFx | xStocks | $11m | B |
| AVGOx | xStocks | $11m | B |
| CLSKx | xStocks | $11m | B |
| IJRx | xStocks | $11m | B |
| EFAon | Ondo | $11m | B |
| CSCOx | xStocks | $11m | B |
| IWMx | xStocks | $10m | B |
| AA_BastionUSDC | Pareto | $10m | O |
| uMINT | UBS Tokenize | $10m | G |
| GOOGLon | Ondo | $10m | B |
| VTx | xStocks | $10m | B |
| ASTSx | xStocks | $10m | B |
| PGx | xStocks | $10m | B |
| bC3M | Backed Finance | $10m | B |
| STRCx | xStocks | $10m | B |
| GSx | xStocks | $10m | B |
| VTIx | xStocks | $10m | B |
| AZNx | xStocks | $10m | B |
| MCDx | xStocks | $10m | B |
| PMx | xStocks | $10m | B |
| KRAQx | xStocks | $9.9m | B |
| HDx | xStocks | $9.8m | B |
| BRK.Bx | xStocks | $9.7m | B |
| PANWx | xStocks | $9.7m | B |
| JPMx | xStocks | $9.6m | B |
| CMCSAx | xStocks | $9.5m | B |
| BACx | xStocks | $9.5m | B |
| UNHx | xStocks | $9.4m | B |
| WBDx | xStocks | $9.4m | B |
| LLYx | xStocks | $9.4m | B |
| COPXx | xStocks | $9.3m | B |
| SNDKx | xStocks | $9.3m | B |
| TMUSx | xStocks | $9.3m | B |
| UBERx | xStocks | $9.2m | B |
| OKLOx | xStocks | $9.2m | B |
| ABBVx | xStocks | $9.2m | B |
| MDTx | xStocks | $9.1m | B |
| STRKx | xStocks | $8.9m | B |
| Token | Platform | Value | Model |
|---|---|---|---|
| IEMGon | Ondo | $8.9m | B |
| Vx | xStocks | $8.8m | B |
| SLVx | xStocks | $8.8m | B |
| MAx | xStocks | $8.7m | B |
| VRTX | xStocks | $8.6m | B |
| TQQQx | xStocks | $8.5m | B |
| IWFon | Ondo | $8.5m | B |
| DHRx | xStocks | $8.3m | B |
| PYPLx | xStocks | $8.3m | B |
| TMOx | xStocks | $8.2m | B |
| SBETx | xStocks | $8.1m | B |
| ABTx | xStocks | $8.1m | B |
| MSFTx | xStocks | $8.0m | B |
| CRWDx | xStocks | $8.0m | B |
| SPCEx | xStocks | $7.6m | B |
| IBMx | xStocks | $7.6m | B |
| BMNRx | xStocks | $7.5m | B |
| BTGOx | xStocks | $7.4m | B |
| KLACx | xStocks | $7.4m | B |
| USARx | xStocks | $7.3m | B |
| NVOx | xStocks | $7.3m | B |
| OPENx | xStocks | $7.1m | B |
| ORCLx | xStocks | $7.1m | B |
| DFDVx | xStocks | $7.0m | B |
| SMHx | xStocks | $6.9m | B |
| ADBEx | xStocks | $6.9m | B |
| RBLXx | xStocks | $6.8m | B |
| ANETx | xStocks | $6.8m | B |
| BTBTx | xStocks | $6.7m | B |
| ACNx | xStocks | $6.7m | B |
| SPKCC | Spiko | $6.6m | G |
| TERx | xStocks | $6.5m | B |
| GEVx | xStocks | $6.5m | B |
| LITEx | xStocks | $6.4m | B |
| PRTS | Securitize | $6.4m | G |
| PWRx | xStocks | $6.4m | B |
| APLDx | xStocks | $6.3m | B |
| CRMx | xStocks | $6.3m | B |
| EEMon | Ondo | $6.3m | B |
| SMCIx | xStocks | $6.2m | B |
| ETNx | xStocks | $6.2m | B |
| LRCXx | xStocks | $6.1m | B |
| TSLAon | Ondo | $6.0m | B |
| DELLx | xStocks | $6.0m | B |
| URAx | xStocks | $5.9m | B |
| UUUUx | xStocks | $5.9m | B |
| AMATx | xStocks | $5.8m | B |
| eurSAFO | Spiko | $5.8m | G |
| CASH+ | Asseto | $5.7m | O |
| VXUSx | xStocks | $5.5m | B |
| APPx | xStocks | $5.5m | B |
| bIB01 | Backed Finance | $5.4m | B |
| VGKx | xStocks | $5.4m | B |
| EUTBL | Spiko | $5.4m | G |
| SLMTx | xStocks | $5.4m | B |
| SMRx | xStocks | $5.4m | B |
| deJAAA | Centrifuge | $5.4m | O |
| CEGx | xStocks | $5.2m | B |
| SGOVx | xStocks | $5.0m | B |
| MOOx | xStocks | $5.0m | B |
| ITAx | xStocks | $4.9m | B |
| IWNon | Ondo | $4.9m | B |
| XLEx | xStocks | $4.7m | B |
| XOPx | xStocks | $4.6m | B |
| LMTon | Ondo | $4.4m | B |
| MSFTon | Ondo | $4.4m | B |
| CRMFR | Libeara | $4.3m | G |
| AAPLon | Ondo | $3.9m | B |
| LLYon | Ondo | $3.8m | B |
| KOon | Ondo | $3.4m | B |
| MUon | Ondo | $3.2m | B |
| AMZNon | Ondo | $3.2m | B |
| METAon | Ondo | $3.2m | B |
| PFEon | Ondo | $3.2m | B |
| AMDon | Ondo | $3.1m | B |
| IWMon | Ondo | $3.0m | B |
| INTCon | Ondo | $2.9m | B |
| IJHon | Ondo | $2.9m | B |
| P3R | MetaWealth | $2.8m | O |
| AA_Adaptive FrontierUSDC | Pareto | $2.8m | O |
| MCDon | Ondo | $2.7m | B |
| PGon | Ondo | $2.6m | B |
| deJTRSY | Centrifuge | $2.6m | G |
| WMTon | Ondo | $2.5m | B |
| CVXon | Ondo | $2.5m | B |
| PEPon | Ondo | $2.5m | B |
| JPMon | Ondo | $2.5m | B |
| PBRon | Ondo | $2.4m | B |
| MSTRon | Ondo | $2.4m | B |
| TMon | Ondo | $2.2m | B |
| ASMLon | Ondo | $2.2m | B |
| NCCNL | MetaWealth | $2.1m | O |
| bCSPX | Backed Finance | $2.1m | B |
| CSCOon | Ondo | $2.0m | B |
| TSMon | Ondo | $2.0m | B |
| MRVLon | Ondo | $2.0m | B |
| SBUXon | Ondo | $1.9m | B |
| bNVDA | Backed Finance | $1.9m | B |
| NFLXx | xStocks | $1.8m | B |
| OLD | MetaWealth | $1.8m | O |
| IBMon | Ondo | $1.8m | B |
| NVOon | Ondo | $1.7m | B |
| BLKon | Ondo | $1.7m | B |
| EQIXon | Ondo | $1.6m | B |
| LINon | Ondo | $1.6m | B |
| Von | Ondo | $1.6m | B |
| XMMF-USDT-ETH | OpenTrade (Perimeter Protocol) | $1.6m | G |
| bCOIN | Backed Finance | $1.5m | B |
| AVGOon | Ondo | $1.4m | B |
| GEon | Ondo | $1.4m | B |
| ABTon | Ondo | $1.3m | B |
| CAMFF | Libeara | $1.3m | G |
| BABAon | Ondo | $1.3m | B |
| WFCon | Ondo | $1.3m | B |
| BAon | Ondo | $1.3m | B |
| UC44 | MetaWealth | $1.2m | O |
| COSTon | Ondo | $1.2m | B |
| MANE | MetaWealth | $1.2m | O |
| COINon | Ondo | $1.2m | B |
| PDDon | Ondo | $1.2m | B |
| ABNBon | Ondo | $1.1m | B |
| BIDUon | Ondo | $1.1m | B |
| HOODon | Ondo | $1.1m | B |
| PANWon | Ondo | $1.1m | B |
| GSon | Ondo | $1.1m | B |
| FUTUon | Ondo | $1.0m | B |
| CMGon | Ondo | $1.0m | B |
| MAon | Ondo | $1.0m | B |
| ACNon | Ondo | $1.0m | B |
| CNCRT | Wavist | $1.0m | G |
| UNHon | Ondo | $998k | B |
| VUGx | xStocks | $994k | B |
| bGOOGL | Backed Finance | $961k | B |
| WG | MetaWealth | $942k | O |
| VCV | MetaWealth | $932k | O |
| JDon | Ondo | $914k | B |
| ARMon | Ondo | $894k | B |
| PYPLon | Ondo | $887k | B |
| HYGon | Ondo | $877k | B |
| CNCC | MetaWealth | $872k | O |
| Token | Platform | Value | Model |
|---|---|---|---|
| DISon | Ondo | $861k | B |
| NKEon | Ondo | $852k | B |
| AXPon | Ondo | $845k | B |
| SPGIon | Ondo | $793k | B |
| INTUon | Ondo | $744k | B |
| UBERon | Ondo | $736k | B |
| HLSCOPE | Securitize | $727k | G |
| DASHon | Ondo | $719k | B |
| CRMon | Ondo | $678k | B |
| SMCIon | Ondo | $677k | B |
| QCOMon | Ondo | $658k | B |
| MELIon | Ondo | $655k | B |
| ADBEon | Ondo | $650k | B |
| APOon | Ondo | $637k | B |
| eurSPKCC | Spiko | $628k | G |
| ACRDX | Centrifuge | $594k | G |
| PAMPH | MetaWealth | $550k | O |
| PLTRon | Ondo | $540k | B |
| SPOTon | Ondo | $504k | B |
| ORCLon | Ondo | $497k | B |
| bMSTR | Backed Finance | $486k | B |
| MONY | Kinexys Digital Assets | $456k | G |
| SHOPon | Ondo | $452k | B |
| RCOIN | Securitize | $448k | G |
| CRDYX | WisdomTree | $414k | G |
| SNOWon | Ondo | $410k | B |
| cSUPQPCDC | cSigma Finance | $408k | B |
| QBTSon | Ondo | $399k | B |
| RDDTon | Ondo | $382k | B |
| 22X | Securitize | $352k | G |
| bTSLA | Backed Finance | $349k | B |
| RIOTon | Ondo | $326k | B |
| bZPR1 | Backed Finance | $285k | B |
| DMMF01 | DigiFT | $284k | G |
| GMEon | Ondo | $256k | B |
| HIMSon | Ondo | $216k | B |
| BMNRon | Ondo | $196k | B |
| bHIGH | Backed Finance | $194k | B |
| FIGon | Ondo | $188k | B |
| APPon | Ondo | $178k | B |
| MARAon | Ondo | $160k | B |
| XOMon | Ondo | $149k | B |
| NOWon | Ondo | $136k | B |
| VTVon | Ondo | $136k | B |
| SBETon | Ondo | $131k | B |
| bIBTA | Backed Finance | $118k | B |
| bGME | Backed Finance | $116k | B |
| bMSFT | Backed Finance | $111k | B |
| SNDKon | Ondo | $110k | B |
| NFLXon | Ondo | $108k | B |
| IRENon | Ondo | $93k | B |
| VRTon | Ondo | $85k | B |
| CEGon | Ondo | $72k | B |
| OXYon | Ondo | $69k | B |
| mBASIS | Midas | $67k | O |
| VTIon | Ondo | $66k | B |
| XTBT-ETH | OpenTrade (Perimeter Protocol) | $66k | G |
| cSUPQPV | cSigma Finance | $56k | B |
| csUSD | cSigma Finance | $55k | B |
| TQQQon | Ondo | $46k | B |
| nELIXIR | Nest | $46k | O |
| OKLOon | Ondo | $32k | B |
| BTGOon | Ondo | $31k | B |
| ONDSon | Ondo | $31k | B |
| RTXon | Ondo | $26k | B |
| VSTon | Ondo | $25k | B |
| FIGRon | Ondo | $24k | B |
| RIVNon | Ondo | $23k | B |
| URAon | Ondo | $22k | B |
| DNNon | Ondo | $22k | B |
| IONQon | Ondo | $22k | B |
| AMATon | Ondo | $18k | B |
| SOFIon | Ondo | $17k | B |
| FXIon | Ondo | $14k | B |
| AALon | Ondo | $12k | B |
| OPENon | Ondo | $12k | B |
| NEEon | Ondo | $12k | B |
| COPon | Ondo | $10k | B |
| LRCXon | Ondo | $9k | B |
| XMMF-ETH | OpenTrade (Perimeter Protocol) | $8k | G |
| JNJon | Ondo | $7k | B |
| MPon | Ondo | $7k | B |
| XEVT-ETH | OpenTrade (Perimeter Protocol) | $6k | G |
| CRWDon | Ondo | $6k | B |
| EWZon | Ondo | $6k | B |
| CAMMU | Libeara | $5k | G |
| ACHRon | Ondo | $5k | B |
| RYT | AlloyX | $5k | O |
| UKTBL | Spiko | $4k | G |
| CVNAon | Ondo | $4k | B |
| NIOon | Ondo | $4k | B |
| USFR.d | Dinari | $3k | O |
| SOUNon | Ondo | $3k | B |
| ABBVon | Ondo | $3k | B |
| SGOVon | Ondo | $2k | B |
| AMGNon | Ondo | $2k | B |
| BBAIon | Ondo | $2k | B |
| TCOMon | Ondo | $2k | B |
| CATon | Ondo | $2k | B |
| Ton | Ondo | $2k | B |
| VZon | Ondo | $2k | B |
| RKLBon | Ondo | $2k | B |
| DGRWon | Ondo | $2k | B |
| CRWVon | Ondo | $2k | B |
| GLXYon | Ondo | $2k | B |
| XYZon | Ondo | $1k | B |
| ISRGon | Ondo | $1k | B |
| Fon | Ondo | $1k | B |
| BACon | Ondo | $1k | B |
| TMUSon | Ondo | $1k | B |
| RGTIon | Ondo | $1k | B |
| PLUGon | Ondo | $1k | B |
| gbpSAFO | Spiko | $1k | G |
| USFRon | Ondo | $1k | B |
| KLACon | Ondo | $842 | B |
| ASTSon | Ondo | $828 | B |
| WULFon | Ondo | $516 | B |
| RDWon | Ondo | $509 | B |
| NBISon | Ondo | $481 | B |
| BINCon | Ondo | $470 | B |
| EWYon | Ondo | $442 | B |
| COFon | Ondo | $400 | B |
| FCXon | Ondo | $382 | B |
| ANETon | Ondo | $371 | B |
| PSQon | Ondo | $238 | B |
| CPNGon | Ondo | $151 | B |
| KWEBon | Ondo | $146 | B |
| SOXXon | Ondo | $90 | B |
| COHRon | Ondo | $47 | B |
| STXon | Ondo | $37 | B |
| WDCon | Ondo | $34 | B |
| UNPon | Ondo | $32 | B |
| INCEon | Ondo | $31 | B |
| VNQon | Ondo | $30 | B |
| UECon | Ondo | $30 | B |
| ENPHon | Ondo | $29 | B |
| SEDGon | Ondo | $28 | B |
| VCXx | xStocks | $0 | B |
Value is gross token value on Ethereum at each token’s net asset value, as of 31 March 2026. Transfer model is determined empirically by simulated transfers, not read from source code. Each row is one token contract. A few products are deployed across more than one contract and are listed per contract. The complete list is also provided as a data file, with contract addresses and full product names.
References
Sources and further reading
All holdings, flows, and entity attributions in this report are Anagram Digital's own. Balances are observed directly on-chain, and entity attributions are inferred from on-chain evidence using Anagram Digital's entity-resolution technology. The sources below support the external context, market framing, and legal and regulatory points referenced in the text.
- rwa.xyz, distributed and represented tokenized-asset value by blockchain. app.rwa.xyz
- BlackRock, Laurence D. Fink, annual chairman's letter on the democratization of investing (2025). corpgov.law.harvard.edu
- J.P. Morgan, research on tokenized money market funds and stablecoins (2026), reported by The Block. theblock.co
- Financial Stability Board, "The Financial Stability Implications of Tokenisation," October 2024. fsb.org
- R. Mafrur, "Tokenized but Illiquid? An Empirical Study of Real-World Asset Tokenization," arXiv (2026). arxiv.org/abs/2606.01131
- Bank for International Settlements, work on tokenisation and financial stability, including run risk and settlement (Hyun Song Shin, BIS FSI). bis.org
- U.S. Securities and Exchange Commission, Commissioner Hester M. Peirce, "Enchanting, but Not Magical: A Statement on the Tokenization of Securities," 9 July 2025. sec.gov
- U.S. Securities and Exchange Commission, Chairman Paul S. Atkins, "Inside Project Crypto" remarks, 12 November 2025. sec.gov
- Tenderly, transaction simulation platform used to test token transfer behavior. tenderly.co
- ERC-3643, the T-REX permissioned-token standard for compliant security tokens. eips.ethereum.org/EIPS/eip-3643
- GENIUS Act (2025), United States stablecoin legislation. White House fact sheet. whitehouse.gov
- Office of Foreign Assets Control, "Sanctions Compliance Guidance for the Virtual Currency Industry" (2021). ofac.treasury.gov
- U.S. Securities and Exchange Commission, Rule 144, resale of restricted and control securities. sec.gov
- U.S. Securities and Exchange Commission, Division of Corporation Finance, "Statement on Tokenized Securities," 28 January 2026. sec.gov
- U.S. Securities and Exchange Commission, "Report of Investigation Pursuant to Section 21(a) of the Securities Exchange Act of 1934: The DAO" (2017). sec.gov
- OSL, omnibus broker model with pooled client-asset custody. osl.com
- ChinaAMC (China Asset Management (Hong Kong)), tokenized fund product documentation. chinaamc.com.hk
- Ondo Foundation, group wallet-address disclosure. blog.ondo.foundation
- Flux Finance, contracts repository (mainnet.config.ts). github.com/flux-finance/contracts
Get the report
Download it, and follow what comes next
Download the report
Take the full report as a designed PDF to read offline or share with colleagues. Download the PDF.
Follow the research
The next installment maps the connectedness behind these holdings. Leave your email and we will send new research when it is published. No marketing, and you can unsubscribe anytime.
Work with Anagram Digital
If you have a matter where the on-chain facts have to be right, or research you need done, tell us in a line. We reply personally. Anagram takes on bespoke engagements for counsel, financial institutions, and funds: litigation support and expert witness work, flow-of-funds tracing, custom research, and due diligence of the kind shown throughout this report. Prefer email? Write max@anagram.digital directly.